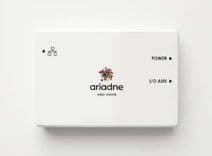
Sensors on lamp posts and behind shop windows
Fusion Pro measures whole streets and open squares without line of sight. It connects over LTE and is specified for -40 to +50 °C.
Ariadne Fusion Pro
Smart city analytics
Ariadne counts the people in your pedestrian zone, on the market square, and in the park, hour by hour, shows how they move between streets, and compares a Christmas market Saturday with an ordinary one. Wirtschaftsförderung, Stadtmarketing, smart city, and tourism teams use the numbers to plan events, brief retailers, and report to the council.
No cameras. No images. No MAC address by default.
Bielefeld, Bremerhaven, Singen, Traunstein, and Siegburg measure their town centres with Ariadne.
Visitor Trajectories
Heatmap
Illustrative views of Ariadne Analytics for one town centre: the heatmap of where people walk, and the Sankey of where they go next.
Customer story
Product tour








What it is
Smart city analytics is the measurement of how many people use a town's streets, squares, and parks, how long they stay, and how they move between them, hour by hour and year on year. Ariadne measures it with Hybrid Fusion, its patented camera-free method: signal sensing on lamp posts or behind shop windows covers whole streets and open squares, and Time-of-Flight sensors count defined passages such as a gate or a bridge. The sensors stream to Ariadne, where both feeds are combined into counts, dwell, and flows per zone.
Counting is the base layer of Ariadne's people counting platform. For the methods behind it, read pedestrian counting methods; for comparing towns, the high street footfall benchmark; and for visitor economies, city tourism analytics.
Products
People counting is the layer underneath. Each of the six views on top of it answers one question a town asks about its centre.
Select a view to see what Ariadne measures in a town
1 of 7
01
Used by: Every team in the town
Visitors and dwell per street, square, and park, and the flows between them, measured without cameras.
Street sensors are calibrated against a manual count
People counting platform02
Used by: Wirtschaftsförderung, Stadtmarketing
Each street, square, and park is a zone drawn on the town map, with its own visitors per hour and dwell bands.
Interest Areas: one map editor for the whole town
Measuring squares and parks03
Used by: Planners, Stadtmarketing
Where people go after the station, the market square, or the car park, as aggregated flows between zones, Sankey diagrams, and heatmaps.
Area Transitions
Watch the Area Transitions tour04
Used by: Retailers' associations, city centre management
Passers-by per street and the share that walks into a shop, for the conversation with retailers and landlords.
Passers by Analysis and Turn In Rate
Watch the Turn In Rate tour05
Used by: Stadtmarketing, event teams
Name the carnival, the Christmas market, or the open Sunday once, compare it with an ordinary day, and let the forecast learn its effect for next year.
Forecast Event Manager: a learned effect per event category
Event crowd management data06
Used by: Every team
Weather and temperature under every daily and hourly chart, and visitors by weather condition, so a rainy Saturday reads as a rainy Saturday.
Visitation by weather condition
Weather and footfall07
Used by: Councils, Wirtschaftsförderung
Compare the town with other smart city projects, or draw regions and compare them week on week and year on year. Monthly PDF reports go to the council.
Industry Benchmarks and Region Benchmarks
High street footfall benchmarkIllustrative sketches of what Ariadne measures in a town centre.
Saturday
A Saturday shows how a town centre is doing. Ariadne shows where people are at every hour: arriving at the station, filling the market square at midday, drifting into side streets, and leaving the park at dusk. Switch to a Christmas market Saturday to see what an event changes.
Plan staff, cleaning, and event times on last year's curve for the same Saturday.
Real-time reporting on Ariadne Advanced and live counts at Time-of-Flight passages. Alerts to email or Microsoft Teams come with Enterprise.
A monthly report for the council, and a named event to compare next year against.
Ariadne counts how many, not who. It shows how the town is used, not who is in it.
Illustrative figures for one town centre on two Saturdays.
Dashboard
One view of the town in Ariadne Analytics: visitors per street every hour, the weather beside them, a street-by-hour heatmap, and this year's Christmas market against last year's.
Visitors today
24,180
Town centre
Busiest street
Hauptstraße
9,420 visitors
Avg dwell in the centre
38 min
Visitors per hour, by street
Weather
Visitors per street by hour
EventsChristmas market 2025Compare withChristmas market 2024
Illustrative data. Labels and controls match Ariadne Analytics.
Every street, square, and park as its own zone, every hour or at any interval.
Aggregated flows between zones, as a map, a Sankey diagram, and a heatmap.
Passers-by per street and the share that walks into a shop.
Name each event once, compare it with another day, and let the forecast learn its effect.
Weather and temperature under every daily and hourly chart, and visitors by weather condition.
Compare with other smart city projects or with regions you draw, week on week and year on year.
PDF reports by email, CSV and xlsx exports, and accounts for partners limited to the streets they need.
Ask about visitors, dwell, flows, and weather in plain language.
Teams
Monthly reports and year-on-year comparison per street, ready for the committee meeting.
Before and after on the same streets. In Waldkirchen's model project, a Christmas stand lifted footfall in a side courtyard about sevenfold, as CIMA's final report shows.
Bielefeld awarded its measurement through an EU tender. Read what buyers ask in people-counting tenders.
CSV and xlsx exports and PDF reports by email. What the city may do with the data, including publication, is set in the contract.
No images, no biometric data, and no MAC address by default, so the measurement starts inside the city's data protection rules.
Braunschweig's 2025 Christmas market drew about 1.32 million visits, 5.5% more than the year before, measured with Ariadne.
Accounts limited to the streets a partner needs, with their own reports.
Passers-by per street and the share that walks into a shop.
Flows from the station and the car parks into the old town, hour by hour.
Weather beside every chart. More in city tourism analytics.
Manual counts give one day. Ariadne gives every hour of every day, street by street.
Hardware
Two kinds of sensor, chosen by the place: signal sensing for whole streets and open squares, Time-of-Flight for defined passages. Both feed the same dashboard.
Fusion Pro measures whole streets and open squares without line of sight. It connects over LTE and is specified for -40 to +50 °C.
Ariadne Fusion Pro
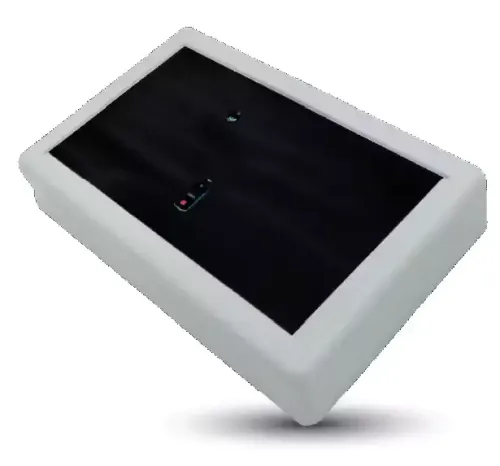
Ariadne ToFu counts every person through a gate, a bridge, or an underpass, with or without a phone, and can be mounted on a pole.
Ariadne ToFu
For a Christmas market or a carnival season, extra sensors go up around the event area for a few months and report in the same dashboard.
Event & Booth Analytics
Install path
Streets, squares, entrances, and parks drawn on the town map.
Ariadne plans which lamp posts and shop windows carry a sensor so every zone is covered.
Sensors go on the lamp posts the city chooses, with power from the mast.
Counts checked against a manual count before go-live.
The dashboard from day one, and a monthly report for the council.
Sensors connect over LTE, so nothing touches the city's network.
For scale: 46 sensors covered Bamberg's town centre, about 100 cover Bielefeld's old town and station quarter, and more than 40 measuring points cover Bremerhaven's pedestrian zone and waterfront.
Integrations
Privacy and procurement
Ariadne captures no images and no biometric data, and no MAC address by default. Time-of-Flight records the geometry of a passing person, not a face. Signal sensing records presence and movement, not identity, and the streams carry no identifier: no MAC address, no device ID. Identifiers are stored only after an explicit opt-in, and no town measurement on this page uses opt-in.
In procurement, Ariadne is a non-biometric measurement system that sits structurally outside the EU AI Act's biometric categories, rather than relying on an exemption. The reasoning is set out in Ariadne's camera-free approach.
Compare
Most towns start from a counting day with clickers, or a counter on one street. The question is what happens between those points.
The usual setup
Clickers, counting days, one counter per street
With Ariadne
Hybrid Fusion, camera-free
Coverage
One counting line per device, or one counting day
Coverage
Whole streets and squares, and the paths between them
Time
A sample day, or one spot every day
Time
Every hour of every day, year on year
Flows
Not measured
Flows
Where people go next, street by street
Events
A separate count on the day
Events
Named events, compared with ordinary days, learned by the forecast
Open squares
Need a doorway or a counting line
Open squares
Covered by signal sensing, no line needed
A counter at one point tells you how many passed that point. Ariadne tells you how the town is used.
Customers
About 100 sensors on light masts in the old town and the station quarter since 08/2024, awarded through an EU tender. More than 11 million visits in the first five months.
Erlebnis Bremerhaven has measured the pedestrian zone and the Havenwelten waterfront since 09/2025, now with more than 40 measuring points and monthly reports.
The pedestrian zone measured since 2023. About 93,000 visitors on carnival Saturday 2024.
Measured since 2022 across the town centre, with 42,682 visitors on carnival Saturday 2024.
The pedestrian zone and the market square, measured since 11/2024 as part of the city's SIEGITAL digital strategy.
28 measuring points in the Kurpark and the shopping streets since summer 2024. At the April 2025 Art and Garden Market, the busiest park zone reached 1,400 visitors by early afternoon.
A model project from 2023 to 2025: about 2.39 million inner-city visits, and a Christmas stand that lifted footfall in a side courtyard about sevenfold.
The Christmas market in 2024 and 2025: about 1.32 million visits in 2025, 5.5% more than the year before.
46 sensors in the town centre for Mitte.Bamberg.2025, with 1,019,399 passers-by in May 2025.
46 sensors in the inner city and at the lakeside, with the dashboard in use from 01/2023.
The Wiesdorf pedestrian zone from 2022 to 2024: 13,515 visitors on carnival Sunday 2024, against 2,489 on the Sunday a week earlier.
Pricing
Three plans, priced per device per month. Which one a town needs depends on one question: monthly reports, or real-time numbers on event days.
01Daily reporting
Counting, sales integration, visitor forecasting, employee scheduling, capture rates, benchmarks, and automated weekly and monthly reports.
Fits monthly council reports, benchmarks, and event comparison.
02Real-time reporting
Everything in Essentials, plus real-time reporting, Threa AI, people flow, demand forecasting, visitor opt-in, and marketing campaigns.
The plan for event days, with real-time reporting and flows.
03Custom features
Volume pricing and custom features such as CRM integration, virtual queuing, alerting, and restroom traffic.
Cities with many districts, and partners measuring several towns.
Background
Hybrid Fusion is covered by DE102022115597A1, EP3964852A1, and CA3125501A1, from work that began at the Technical University of Munich.
City and retail partners, including CIMA, BBE Handelsberatung, and Urban Lighting Innovations, work with Ariadne.
Over 800 locations in 32 countries, across retail, shopping centers, airports, cities, and venues.
FAQ
Ariadne does not collect personal data in the first place: no images, no biometric data, and no MAC address by default. What a city receives is counts, flows, and dwell times per zone, which contain no identifiers. That is a different starting point from camera analytics, where personal data is captured and must then be protected.
The Act's high-risk Annex III categories address biometric identification and categorisation. Ariadne performs neither: nothing biometric is captured at the sensor and no demographic attributes are detected. The architecture sits structurally outside those categories, which simplifies the procurement review.
By default the city may use the data for its own analysis without time limit. Publication, for example on an open-data portal, can be agreed in the contract. The outputs are aggregate counts and flows with no personal data in them.
Pedestrian traffic on streets and squares, dwell in parks and plazas, flows between zones, event attendance, and how all of it shifts with weather and season. Bielefeld, Bremerhaven, Singen, Traunstein, Siegburg, and Bad Nauheim measure their centres this way, and Waldkirchen ran a model project from 2023 to 2025.
CCTV analytics starts from video, so it creates personal data that then needs safeguards, retention rules, and impact assessments. Ariadne starts from depth geometry and phone signals, and stores no images, no biometric data, and no MAC address by default.
Yes. Signal sensing measures movement across open spaces where a door-based counter has nothing to attach to, and Time-of-Flight depth sensing covers defined passages such as station entrances or bridges. Deployments combine both as the space requires.
On lamp posts or behind shop windows, with power from the mast or the shop. They connect over LTE, so they need no access to the city's network. Ariadne plans the positions on the town map and checks the counts against a manual count before go-live.
Yes. Extra sensors can go up around the event area for a season and report in the same dashboard. Braunschweig measured its Christmas markets in 2024 and 2025 and counted about 1.32 million visits in 2025, 5.5% more than the year before.
Yes. Every daily and hourly chart shows the weather and temperature beside the counts, from an external weather feed, and the forecast view shows visitors by weather condition.
Yes. Bielefeld awarded its town-centre measurement through an EU tender. Ariadne's guide to people-counting tenders covers what buyers usually ask for.
Resources
Field notes on town centres, events, and public spaces from the Ariadne blog.

Libraries, transit, city halls, campuses: how public bodies buy people counting, what the compliance layer adds, and how to write a spec that gets real bids.

Sunlight is an infrared floodlight aimed at your sensor. The physics of ambient light noise, and the engineering that keeps outdoor ToF deployments honest.

Measure turnout and movement at festivals and city events: multi-entrance counts, arrival curves, dwell across the site, and camera-free outdoor sensing after
Related
Visitors per street, flows, events, weather, and benchmarks in Ariadne Analytics.
How Ariadne counts, from Time-of-Flight passages to whole streets.
For venues, trade fairs, and fan zones.
Two questions, twenty minutes, a real walkthrough of your venue's footfall.
What to expect
Got a different question?
Anything that isn't a sales conversation. We'll route it to the right person and get back within one business day.