Ariadne Analytics

The visitor analytics dashboard

Ariadne Analytics is the visitor analytics dashboard for any physical space. It shows live counts, dwell time per zone, polygon heatmaps, queue-time alerts, and conversion paths. Plug in Hybrid Fusion sensors for a clean install, or feed the dashboard from existing Wi-Fi access points and sensors via EaseLink. Nothing personally identifying leaves the device.

What it shows · 1 of 3

Counts and occupancy

Every entry, exit, and zone of the venue is counted live. Operations teams see how many people are inside each zone at any second, plus historical patterns over the day, week, and season.

  • Live entry, exit, and zone occupancy, updated in seconds
  • Dwell time per zone, broken down by daypart and segment
  • Trend lines by hour, day, season for staffing and merchandising
  • Peak detection with threshold alerts
app.ariadne.inc/analytics
Live occupancy chart for a retail floor showing real-time entry counts and dwell time per zone

What it shows · 2 of 3

Movement and zones

The dashboard turns identifier-free journeys into maps. See which zones visitors enter together, where they linger, and which routes they take through the venue.

Our edge

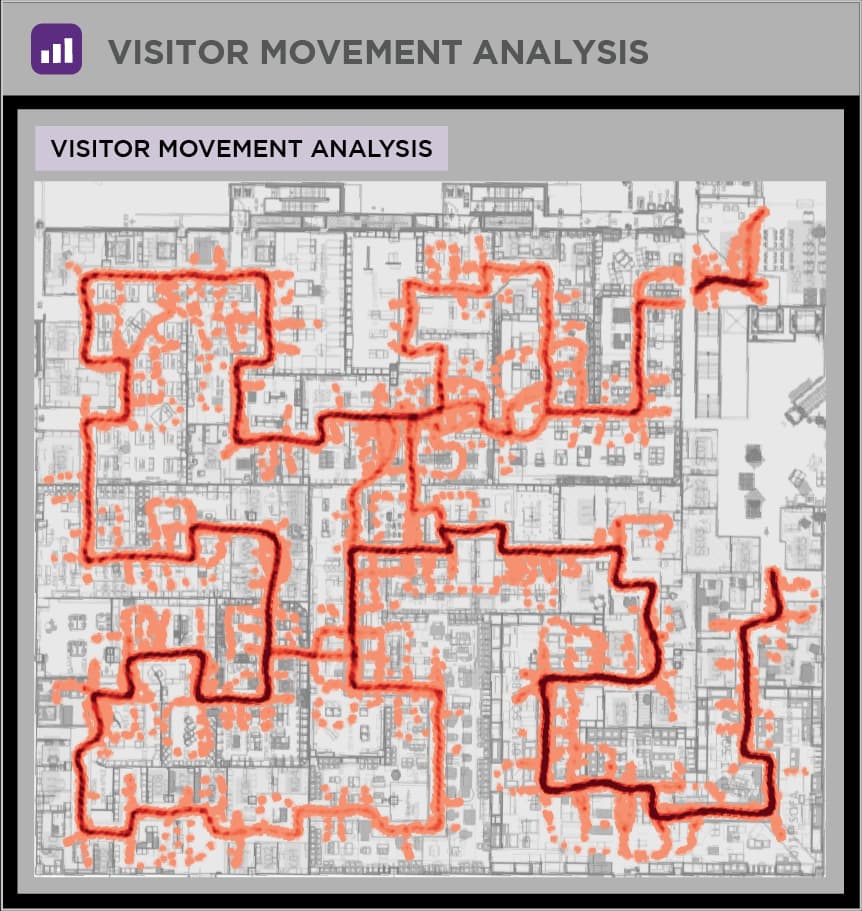
Visitor trajectories

Identifier-free paths from entrance to exit. Reveals natural traffic flow, alternative routes, bottlenecks.

  • Anonymised journey from entry to exit, end to end
  • Surfaces shortcuts, dead zones, and bottlenecks
  • Filter by daypart, day of week, or campaign window
Path overlay across a shopping centre floor plan, with arrow density showing common routes from entrance to anchor stores
Polygon-level heatmap with custom-drawn zones over a retail floor plan; warmer polygons show higher dwell concentration

Polygon heatmaps

Custom polygon zones, drawn over the floor plan. Heatmap density per polygon, dwell distribution per polygon, conversion per polygon.

  • Draw, edit, and rename polygons in the dashboard
  • Per-polygon dwell, occupancy, and conversion
  • No sensor re-deploy when zones change
Sankey diagram of zone-to-zone visitor transitions, with width encoding proportion of visits

Area transitions

Cross-zone movement. Which zones feed which, in what proportion. Cross-sell and merchandising signal.

  • Sankey-style proportions between zones
  • Cross-zone behaviour for cross-sell and merchandising
  • Compare against last week, last month, or baseline

What it shows · 3 of 3

Performance and conversion

The dashboard correlates visit data with the venue's outcomes: sales, queue length, marketing-campaign reach, peer benchmarks.

Conversion funnel diagram showing walk-bys, store entries, and transactions across an hour-by-hour breakdown

Conversion

Conversion paths

Foot-traffic vs transactions. Storefront pull-in, enter-to-purchase, with daypart and campaign attribution.

  • Walk-by-to-enter ratio per storefront
  • Enter-to-purchase with hour-by-hour breakdown
  • Campaign attribution and time-of-day impact
Live queue-time line chart with alert threshold marker; historical comparison overlay shows last week's queue at the same hour

Queue

Queue alerts

Real-time queue length per checkpoint. Staff-intervention thresholds. Historical queue patterns for staffing plans.

  • Real-time queue length per checkpoint
  • Threshold alerts pushed to staff devices
  • Historical patterns for staffing plans
Benchmark chart comparing one venue's queue times against the Ariadne network average for the same week of the year

Benchmark

Industry benchmarking

Compare a venue's metrics against the Ariadne network's peer averages. Anonymised, opted-in benchmarks per industry.

  • Anonymised peer averages per industry
  • Same-week, same-hour comparisons
  • Opt-in-only benchmark pool

Same app, more dashboards

Beyond core analytics

These metrics power other dashboards in the same Ariadne app. Built on the same Hybrid Fusion data, opened from the same login.

Employee scheduling dashboard showing hourly staff allocation aligned with predicted footfall

Employee scheduling

Align staff levels with predicted footfall. Hour-by-hour shift planning against the same visitor data.

See staff scheduling
Visitor marketing dashboard showing campaign recommendations and attribution to dwell time

Visitor marketing

Trigger location-based campaigns from the same anonymised journey data. Attribution back to dwell time.

See visitor marketing

Sensors and fusion

Built on Hybrid Fusion

The dashboard is the visible end of Hybrid Fusion, Ariadne's patented method for measuring people in any physical space. Patented phone signal sensing handles the inside-the-venue journey. Time-of-Flight depth sensing handles entries and exits. Both run on a single edge device. The fused, identifier-free stream feeds the dashboard in real time.

How Hybrid Fusion works
signalToFfused

Already running Wi-Fi access points from Aruba, Cisco, Sophos, Ruckus, or TP-Link? EaseLink feeds the dashboard from existing infrastructure. No new sensors.

EaseLink: use existing infrastructure

Industries

Built for every industry

Same dashboard, tuned for the metrics that matter in each industry.

Airports

Passenger flow, queue alerts, gate occupancy

Smart cities

Pedestrian flow, public-space density, urban mobility

Outcomes

What teams do with it

Real outcomes from real venues. Cards rotate as the customer wall rotates.

Weko
We recorded the ROI already in the first month with a 40% increase in product revenue!

Rainer Latzlsperger

Vorstand

Ö-Center
When they said: We are the Google Analytics of the physical world, they were not kidding!
Thomas Grabert

Thomas Grabert

Managing Director

San Diego Airport
A truly plug-n-play solution! I did the installation myself!.
Gina Jacobs

Gina Jacobs

Manager

Privacy by architecture

Identifier-free by default. Hosting on your terms

Ariadne Analytics never receives video, faces, or device identifiers. The sensor never captures them in the first place. Counts and paths leave the device identifier-free. Identifiers are stored only when a visitor explicitly opts in, for example through a guest Wi-Fi login. The dashboard's data layer is hosted on the customer's choice of cloud (Azure, AWS, or GCP), with EU data residency available where procurement requires it. The architecture sits structurally outside Annex III high-risk categories of the EU AI Act because no biometric data is captured or processed. GDPR-native by design (Article 25).

For the deeper architectural comparison against camera-based dashboards, see why Ariadne.

No cameras

No video, no still frames, no facial-recognition pipeline.

No PII by default

Counts and paths are identifier-free. Identifiers exist only on visitor opt-in.

Hosting on your terms

Data hosted on Azure, AWS, or GCP. EU residency available where procurement requires it.

Audited and certified by

GDPR Privacy CertificationAccenture PartnerTÜV Accuracy CertificationBayern Partner
Privacy by architecture: identifier-free input, identifier-free outputWHAT WE DO NOT CAPTUREfacesvideo framesMAC by defaultdemographicsWHAT WE MEASUREpresencemovementidentifier-free input, identifier-free outputnothing to anonymise: nothing identifying is captured

Where the data goes next

Push to BI, CRM, POS, scheduling

The dashboard is the read surface. Identifier-free metric streams also push to the systems the venue already runs. POS reconciliation feeds conversion. Workforce platforms feed staff scheduling. BI tools consume the underlying tables. CRM systems take aggregated visit signals for retargeting.

Logos read from the CMS, so this card stays current as new integrations ship.

SITA
SITA
Amadeus
Amadeus
HubSpot
HubSpot
Pipedrive
Pipedrive
Salesforce
Salesforce
Power BI
Power BI
Tableau
Tableau
Grafana
Grafana

API and exports

REST API for live metrics. Scheduled CSV and Parquet exports for warehouses. SSO via the customer's existing identity provider.

FAQ

About the dashboard

Quick answers on what the dashboard shows and how it integrates.

What is Ariadne Analytics?

Ariadne Analytics is the visitor analytics dashboard for any physical space. It shows live counts, dwell time per zone, polygon heatmaps, queue-time alerts, and conversion paths. Data feeds in either from new Hybrid Fusion sensors at the venue, or from existing Wi-Fi access points and sensors via EaseLink. Nothing personally identifying leaves the device.

What metrics does the dashboard show?

Counts and occupancy per zone, dwell time, visitor trajectories, area-to-area transitions, polygon heatmaps, conversion paths, queue length and queue-time alerts, and benchmarks against the Ariadne network's peer averages. All updated in real time.

How does Ariadne Analytics integrate with BI, POS, and CRM?

The dashboard is the read surface; metric streams also push to existing systems through pre-built connectors (the current integration list lives at /platform/integrations/), a REST API for live metrics, and scheduled CSV or Parquet exports for warehouses. SSO via the customer's existing identity provider.

Is the data real-time?

Yes. Counts and queue-time metrics update within seconds of detection. Heatmap and trajectory views render against live aggregations. Historical views compare any rolling window against same-period baselines.

Does Ariadne Analytics support custom polygon zones?

Yes. Operations teams draw polygons over the venue floor plan in the dashboard. Each polygon gets dwell distribution, occupancy over time, conversion contribution, and cross-polygon transitions. Polygons can be edited at any time without re-deploying sensors.

Where is Ariadne Analytics hosted? Is it GDPR-compliant?

The dashboard's data layer is hosted on the customer's choice of cloud (Azure, AWS, or GCP), with EU data residency available for venues that require it. It is GDPR-native by design (Article 25 privacy-by-design) because the underlying Hybrid Fusion sensors do not capture biometric data and do not collect MAC addresses or device IDs by default. The architecture sits structurally outside Annex III high-risk categories of the EU AI Act.

Pair with

Where to next

Solution

Staff scheduling

Use the same visitor data to align staff levels with predicted footfall.

Solution

Indoor navigation

Same sensors, different output. Browser-native indoor wayfinding for visitors who opt in.

Talk to us

Two questions, twenty minutes, a real walkthrough of your venue's footfall.

What to expect

  • 20-minute screen share, walked through on your venue map
  • Live walkthrough of Hybrid Fusion sensor outputs
  • Where Ariadne fits, and where it doesn't

Got a different question?

Send us a message

Anything that isn't a sales conversation. We'll route it to the right person and get back within one business day.