
A theme park counts everyone who comes through the turnstiles, and on a busy day that number runs into the tens of thousands. It is also almost useless for running the park hour to hour, because it says nothing about where those thousands actually are. The same daily total can mean a comfortable, well-spread day or a day where one land is gridlocked while another sits empty, where the queue for the headline coaster spilled into a walkway and the food court ran a forty-minute wait at one o'clock. The gate gives you the total. It does not give you the distribution, and distribution is what operations manage.
This is a guide to attendance analytics for a theme park, scoped to where the data is genuinely useful: entrances, zones, attractions, and the chokepoints between them. It covers flow between lands across the day, queue build at rides and facilities, how a large mixed indoor-and-outdoor site is counted camera-free, and how a duty manager uses the live and historical pictures to run the day and plan the season. It does not promise total coverage of every square metre of a park from a single sensor type, because that is not how the technology works, and it is an operational input rather than a certified safety system.
What do attendance analytics tell a theme park?
Gate scans give a theme park a daily total, but they say nothing about how that crowd distributes once inside. Attendance analytics measure flow between lands, queue build at rides and toilets, and dwell at food outlets and shops through the day. That lets operations move staff to the busy zone, open a second queue line, and time parades or character meets to relieve a pinch point. The same zone data, reviewed after the day, shows which attractions and routes carry the park and which are quietly underused.
The unit of insight is the zone and the chokepoint, not the whole park as one number and not every individual visitor. That is the right altitude for the decisions a duty manager actually makes during the day.
The theme-park pain point: one gate total hides where the crowd actually goes and where it jams
The thing that ruins a guest's day at a theme park is rarely the total attendance. It is the distribution of that attendance: the land that is packed while another is quiet, the ride queue that has crept past an hour, the toilets with a line out the door, the single food outlet everyone hit at lunch. A park can have a moderate day by the gate count and still feel broken if the crowd piles into the same places at the same times.
Operations spend the day chasing this by radio and by eye. A supervisor notices a queue building and calls for another team member; a manager hears the food court is slammed and sends help, usually after the wait has already formed. The problem is that the park is huge, the crowd moves between lands continuously, and no one standing in one spot can see the whole distribution. By the time a pinch point is visible to a person on the ground, it has already cost guests their patience. The gate total cannot help, because it was fixed at the turnstile hours ago and says nothing about the live spread. What operations needs is the distribution as it changes, zone by zone, so the response comes before the crush rather than after it.
There is a quieter cost on the other side of the same problem. While operations chases the jam in one land, another land sits underused, with staff standing at attractions nobody is reaching and a food outlet that prepared for a lunch rush that went elsewhere. The radio-and-eye method is good at finding the crush and blind to the emptiness, so the park ends up overstaffed where the crowd is not and understaffed where it is, both at once. The waste is real money, and it is invisible without a view of the whole distribution. Seeing the cold zones is as useful as seeing the hot ones, because it is where the staff to relieve the pinch point are already standing idle.
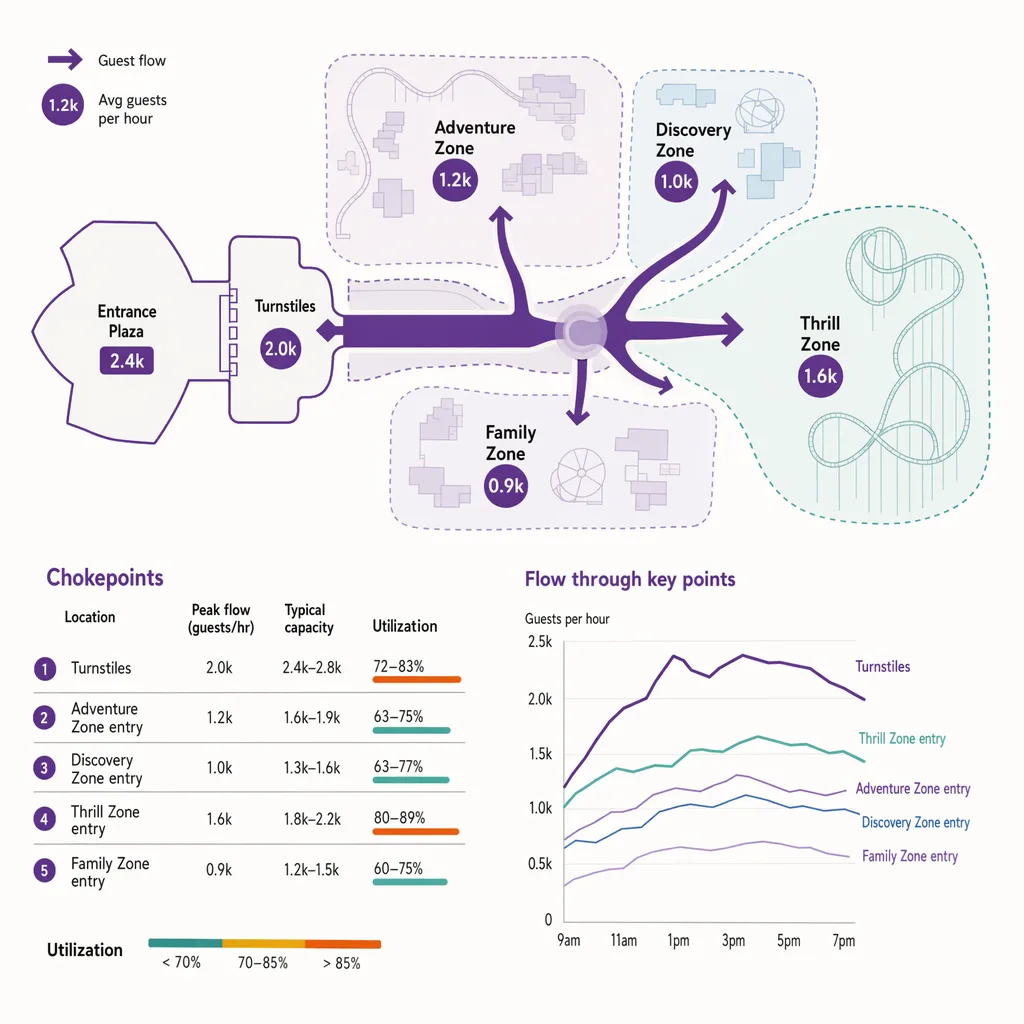
Flow between zones and lands across the day
The core of attendance analytics for a park is flow between zones: how the crowd moves from the entrance plaza out into the lands, and how it redistributes as the day goes on. Morning typically loads the headline attractions nearest the gate; midday pulls toward food; afternoon and evening shift again toward shows, water rides in heat, or the exit. Each park has its own rhythm, and once you can see it as live zone counts rather than radio reports, you can manage it instead of reacting to it.
Real-time counts by zone let operations see a land filling and move staff, open capacity, or push a diversion before it tips into gridlock. The same principle that runs event crowd flow data at a festival applies across a park: knowing where the crowd is concentrating, while it is concentrating, is what turns a reactive day into a managed one. The data informs operational decisions; it is not a certified crowd-safety system, and a park's safety planning and capacity limits sit under their own regulated controls.
Queue build at rides, food, and toilets
Queues are where attendance turns into guest experience, for better or worse. A ride queue that builds steadily is normal; one that builds faster than the ride clears is a problem you want to catch early. Counting at the approach to attractions, food outlets, and facilities shows the build rate, not just the current length, which is the difference between reacting and anticipating.
That feeds concrete moves: open a second queue line or a virtual-queue release before the main line spills into a walkway, send a team to the food outlet that is about to back up, service the toilets on the block where the traffic actually went rather than on a fixed round. The point is to act on the build, not the eventual jam. A queue you relieve at the ten-minute mark never becomes the forty-minute wait that ends up on a review.
The food and facility side is where the build rate earns its keep most clearly, because those queues are predictable in a way ride queues are not. Lunch loads the food outlets in a wave that follows the morning's ride pattern by an hour or so, and the toilets fill on the blocks where the crowd actually went, not where the cleaning round assumed it would. Watching the approach counts climb lets a manager pre-position a second till at the outlet about to back up and route the cleaning team to the busy block rather than the scheduled one. These are small moves, but they are the difference between a guest's lunch break being a pleasant pause and being the part of the day they mention in a one-star review. The data does not run the park; it tells the people running it where to be ten minutes before they would otherwise have found out.
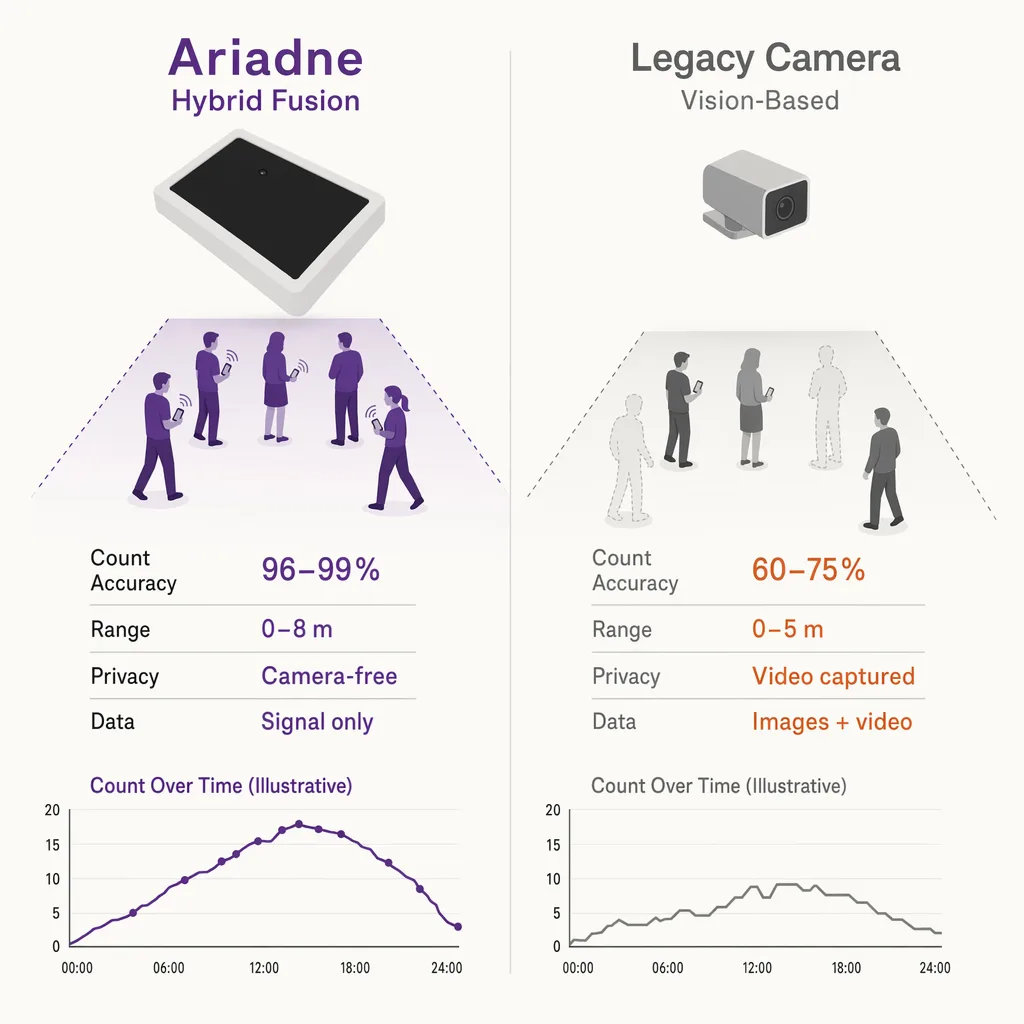
Counting across a large open site, camera-free
A theme park is a hard counting environment and an unusual one: a mix of outdoor plazas and walkways, indoor attractions and shops, wide flows and tight chokepoints, all at scale. No single sensor blankets it, and it would be wrong to claim one does. The realistic approach is to instrument what matters: the entrances, the gateways between zones and lands, the approaches to major attractions and facilities, and the food and retail outlets. That gives you the flow and queue picture where decisions are made, without pretending to track every guest across every metre.
Ariadne measures this with Hybrid Fusion, its patented camera-free method. Time-of-Flight depth sensing counts every visitor at the entrances, capturing geometry rather than images, while patented phone signal sensing follows movement through the interior, detecting the signals a phone emits even in airplane mode. The sensor streams both feeds to Ariadne, where Hybrid Fusion combines them into one trajectory per visit and computes counts, dwell, and paths. The streams carry no identifier: no MAC address, no device ID, no biometric data, and no camera is involved. Identifiers are stored only when a visitor explicitly opts in, which keeps the method GDPR-friendly and outside biometric territory.
For a park that means depth sensing counts accurately at gates and zone gateways even with families and groups arriving together, and the interior signal sensing follows movement between instrumented zones to give the flow picture. It is camera-free, which matters in a leisure setting full of families and children where surveillance is the wrong tool and the wrong message.
From counts to action: staff redeployment, show timing, capacity decisions
The data drives the moves a duty manager makes through the day.
Staff redeployment is the immediate one. The live zone picture shows where the crowd is heading, so operations can move team members toward the land or outlet that is loading up before it becomes a complaint, and pull them from a zone that has gone quiet. Reading the zone picture as a heatmap makes the hot and cold areas obvious at a glance.
Show and parade timing is the second. A parade, a character meet, or a show release pulls crowd toward its route and away from the rest of the park. Timed against the live distribution, that becomes a tool: schedule or position an attraction to draw people off a pinch point rather than purely on a fixed clock.
Capacity and planning decisions are the third. The same zone data, reviewed after the day, shows which attractions and routes carry the park and which sit underused, which lands jam predictably, and where a new path or outlet would relieve a recurring bottleneck. Acting on flow data is what turns a day of firefighting into a season of better layout and staffing plans. The people counting platform holds both the live and the historical view.
How a duty manager actually uses the numbers
On the day, the manager works from the live zone picture the way the cinema duty manager works from the lobby count, just at a larger scale. A screen showing the lands filling and the major approaches building lets them push staff toward the zone that is loading up before it becomes a complaint, time a parade or character meet to draw crowd off a pinch point, and release a virtual queue before a ride line spills into a walkway. The radio is still how the instruction goes out; the difference is that the manager now sees the distribution forming rather than waiting for a supervisor to report it.
After the day, the same data answers the planning questions. Reviewing a week of zone curves shows which lands jam at the same time every day, which attractions carry the park and which sit quiet enough to question, and where a recurring bottleneck would be relieved by a new path, an extra outlet, or a different show schedule. Across a season that builds into the staffing and layout plan, so the park spends less of next year firefighting the jams it already knows are coming. The live view runs the day; the historical view plans the season; and both stay firmly on the operational side of the line, because the park's safety planning, capacity limits, and emergency procedures sit under their own regulated controls and are not replaced by any of this.
FAQ
Can attendance analytics track every guest across the whole park?
No, and it should not claim to. The realistic approach instruments the points that matter: entrances, gateways between zones and lands, approaches to major attractions, and food and retail outlets. That gives you the flow, queue, and dwell picture where operational decisions are made, without trying to follow every individual across every metre of the site.
How is this different from the gate count?
The gate count is a daily total fixed at the turnstile. Attendance analytics show the live distribution: which zones are filling, where queues are building, and how the crowd redistributes through the day. The gate tells you how many came; the analytics tell you where they are now, which is what operations actually manages.
Does counting a theme park require cameras?
No. Ariadne counts camera-free using Time-of-Flight depth sensing at gates and zone gateways plus phone-signal sensing through instrumented interior areas, with no video and no biometric data. That suits a family leisure environment where camera surveillance is the wrong tool.
Is this a crowd-safety system?
It is an operational input, not a certified safety system. The data helps operations see crowding build and respond earlier, but a park's safety planning, capacity limits, and emergency procedures sit under their own regulated controls and are not replaced by attendance analytics.
Can it show queue build before the queue gets long?
Yes. Counting at the approach to an attraction or outlet shows the build rate, not just the current length, so operations can open a second line or release a virtual queue before the line spills into a walkway and becomes a long wait.
Does the data help with anything beyond running the day?
Yes. Reviewed after the day and across a season, the same zone curves show which lands jam predictably, which attractions carry the park and which are underused, and where a new path or outlet would relieve a recurring bottleneck. That turns a record of daily firefighting into a planning input for staffing rotas and layout decisions, so next season meets the known jams better prepared.
---


