
Search "visitor flow" and half the results are about a website. Google Analytics used to ship a "Visitors Flow" report (later "Users Flow"), a diagram of how people click from one web page to the next. This post is about the other visitor flow: the physical movement of real people through a real building. When someone walks into a museum, a science centre, or a gallery, they take a route. They pause at some things, walk past others, cluster at the popular exhibit, drift toward the cafe around lunch, and leave by a door that may or may not be the one they came in through. That physical pattern is what venue teams mean by visitor flow, and it is what this article is about.
The two are measured with different tools and answer different questions. The web report tells you which page loses people. Physical visitor flow tells you which gallery empties out at 15:00, where the queue for the special exhibition spills into a fire route, and whether the building is inside its safe capacity on a wet Saturday. If you run an attraction, a heritage site, a zoo or aquarium, or a university campus with public spaces, that second question shapes your day. This post covers what visitor flow means inside a venue, why it matters, what a good pattern looks like, and how to measure and manage it without cameras.
What is visitor flow?
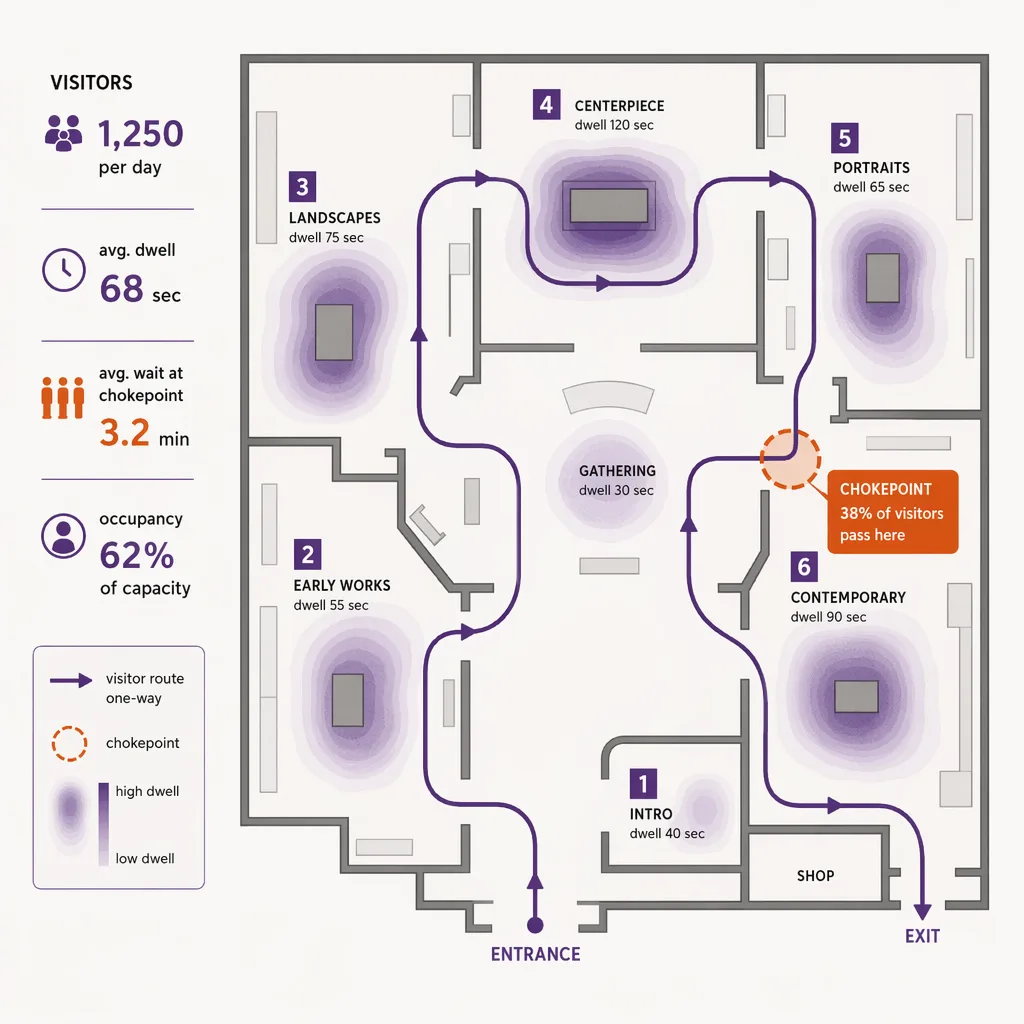
Visitor flow is how people move through an attraction or venue: where they enter, the route they take past exhibits or zones, where they slow down or cluster, how long they dwell, and where they leave. It is the physical-space version of the term, not the Google Analytics "Visitors Flow" report about clicks through a website. For a museum, gallery, science centre, or campus, good visitor flow means guests reach what they came for without crowding at chokepoints, and the venue stays inside its safe capacity. Ariadne measures visitor flow camera-free, counting every arrival and following movement and dwell inside without capturing any personal data.
The rest of this post takes that apart in the order a venue team tends to need it: why the pattern matters operationally, what a healthy pattern looks like, how you measure it without cameras, how you act on it, and where the venue picture ends and the wider city picture begins.
Why visitor flow matters at attractions: dwell, bottlenecks, capacity, experience
A venue lives and dies on how its space performs, and visitor flow is the direct read on that. Four things depend on it.
Dwell is the first. How long people spend in a gallery, at an exhibit, or in the building overall is the clearest signal of what is working. A room nobody lingers in is either a thoroughfare or a disappointment, and the difference matters for what you put there next. Dwell at the whole-venue level also drives secondary spend, because a guest who stays longer is a guest who visits the cafe and the shop. You cannot manage dwell without measuring it, and a ticket scan at the door tells you nothing about it.
Bottlenecks are the second. Every venue has chokepoints: a narrow corridor between two popular galleries, the single door into a blockbuster exhibition, the lift that everyone with a pushchair needs. When arrivals pile up faster than the space clears them, the experience degrades and, past a point, it becomes a safety issue. Knowing where the pinch points are and when they bite is the difference between staffing them and discovering them during a complaint.
Capacity is the third, and it is increasingly a compliance question rather than a comfort one. Many venues operate under an occupancy limit set by their safety case, their insurer, or a licensing authority. Staying inside it means knowing, in real time, how many people are in the building right now, not how many tickets you sold this morning. Those are different numbers, because people arrive over hours and leave over hours.
Experience ties the three together. Guests who reach what they came for without fighting a crowd rate the visit higher and come back, and that is measurable through the same signal that drives the operational decisions.
What good visitor flow looks like: circulation patterns, one-way routes, timed entry
A well-run venue is not one where visitors are herded. It is one where the building's design and the day's operation quietly guide people so the space works. A few patterns recur.
Even circulation is the baseline. In a healthy pattern, guests spread across the available galleries rather than bunching in one and leaving the rest empty. When a count shows one zone running hot while three sit idle, the fix might be signage, a moved highlight, or a staff member gently pointing the way, but you can only make that call once you can see the imbalance.
One-way routes are a common tool, especially for special exhibitions and heritage properties with tight rooms. A defined route keeps people moving in one direction, prevents the counter-flow that causes crushes in narrow spaces, and gives every guest the intended sequence. The trade-off is rigidity, so many venues reserve one-way routing for the highest-pressure spaces and let the rest of the building circulate freely.
Timed entry is the sharpest lever an attraction has over its own flow. By releasing guests in slots rather than all at once, a venue flattens the arrival curve and turns an unpredictable surge into a planned sequence. It only works, though, if the slot sizes are set against real capacity and real dwell. Set them by guesswork and you either leave money on the table with slots that are too small or recreate the crush you were trying to avoid with slots that are too big. This is where measurement stops being a nice-to-have and becomes the input that makes the whole scheme work.
How to measure visitor flow, camera-free
Cameras are the obvious tool for watching how people move, and they are the wrong one for most venues. They carry a privacy burden that sits badly in a public cultural space, they need review and signage, and in many museums and galleries they are simply not welcome. The good news is that you do not need them to measure flow accurately.
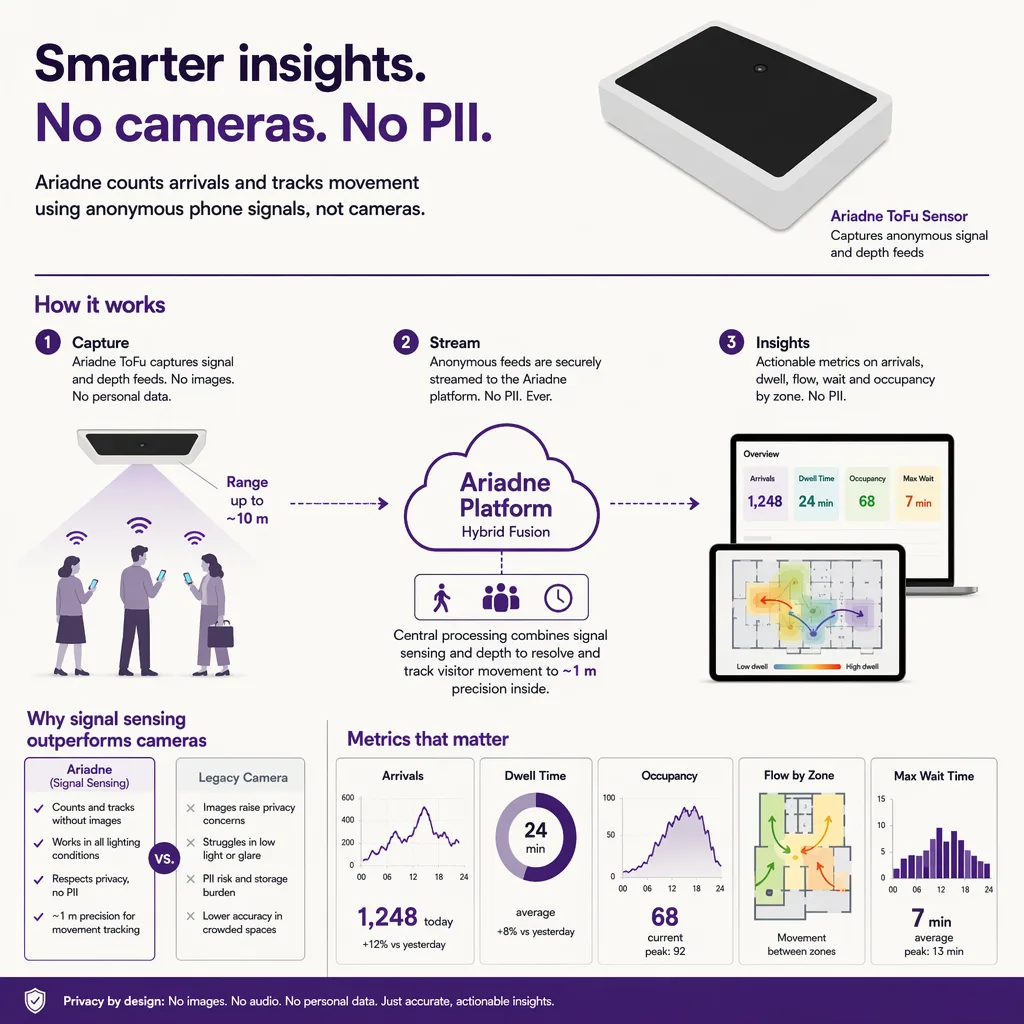
Ariadne measures this with Hybrid Fusion, its patented camera-free method. Time-of-Flight depth sensing counts every visitor at the entrances, capturing geometry rather than images, while patented phone signal sensing follows movement through the interior, detecting the signals a phone emits even in airplane mode, and tracks that movement to about one-metre precision. The sensor streams both feeds to Ariadne, where Hybrid Fusion combines them into one trajectory per visit and computes counts, dwell, and paths. The streams carry no identifier: no MAC address, no device ID, no biometric data, and no camera is involved. Identifiers are stored only when a visitor explicitly opts in, which keeps the method GDPR-friendly and outside biometric territory.
For a venue, that produces three things a ticket system never can. An accurate count of who is actually in the building, updating live, which is the number your capacity limit is really about. Dwell per zone, so you can see which galleries hold attention and which are thoroughfares. And path data, the routes visitors actually take, which is what tells you whether your intended circulation matches reality. Because it is a real-time signal rather than a day-end tally, the same feed that plans next season also runs today's floor. For the underlying mechanics, see real-time people counting, and for how the counting works across a site, camera-free people counting.
Managing visitor flow: capacity caps, timed entry, staffing to the curve
Measurement earns its place when it changes what the floor does. Three actions cover most of it.
Capacity caps come first because they are the non-negotiable one. With a live occupancy figure for the building, and ideally per zone, the venue can hold entry when a space approaches its limit and release it as the space clears, rather than relying on a morning ticket count that says nothing about who has already left. A live number turns a static licence condition into something the team can actually manage through the day.
Timed entry is where the data pays back most visibly. Set slot sizes against measured capacity and typical dwell rather than a round guess, and the arrival curve flattens without leaving the building half-empty. Watch how each slot actually fills and clears, and you can tune the slots over a season until they match how your guests really move. The dashboard behind this, where counts, dwell, and occupancy come together, is Ariadne Analytics.
Staffing to the curve is the third. An attraction's day has a shape: a morning build, a midday peak, an afternoon that depends on the weather and the school calendar. Rostering front-of-house, gallery hosts, and cafe staff to that measured curve instead of a flat all-day pattern puts people where the crowd is, which is both a service gain and a cost one. The same curve tells you when to open a second entry lane or staff a known bottleneck before it forms rather than after a guest complains.
Visitor flow beyond the walls: the city and outdoor picture
Everything above is about the interior of a venue. The moment you step outside the building, into the plaza, the surrounding streets, the festival, or the destination as a whole, the question changes, and so does the post that answers it.
If you run a destination and want to know what visitor-flow data tells a tourism body about where visitors go across a city, that is the outdoor and destination angle, covered in city and tourism visitor analytics. If your concern is how full a public plaza, park, or open square gets and how that occupancy changes through the day, that is public space occupancy. And if you are planning around the turnout for a city event or festival, the crowd movement of an outdoor event is its own problem, covered in event pedestrian flow. All three sit alongside this post under the broader idea of customer flow, the cross-sector view of how people move through any space where they are served. This post stays inside the venue walls; those cover the world outside them.
FAQ
Is this the same as the Google Analytics Visitors Flow report?
No. The Google Analytics "Visitors Flow" report (later renamed "Users Flow") mapped how people clicked from one web page to the next on a website. This post is about physical visitor flow: how real people move through a building such as a museum, gallery, or attraction. The two share a name and nothing else. One is a web-navigation diagram; the other is measured movement through physical space.
Does measuring visitor flow require cameras?
No. Ariadne counts with Hybrid Fusion: Time-of-Flight depth sensing plus patented phone signal sensing, never cameras. Time-of-Flight captures geometry rather than images, and signal sensing captures no MAC address by default, so the measurement involves no video, no faces, and no biometric data.
How is visitor flow different from just counting tickets?
Tickets tell you how many people you sold entry to and roughly when they arrived. They say nothing about how many are in the building right now, which galleries hold attention, or where people bottleneck. Visitor flow measures live occupancy, dwell per zone, and the routes guests actually take, which is what capacity management and timed entry depend on.
Can visitor flow data set timed-entry slot sizes?
Yes, and it is the input that makes timed entry work. Slot sizes set against measured capacity and typical dwell flatten the arrival curve without leaving the venue half-empty. Watching how each slot fills and clears lets a venue tune slot sizes over a season to match how guests really move.
Does it work for zoos, aquariums, and campuses, not just museums?
Yes. The same approach applies to any indoor venue where people circulate: science centres, exhibitions, heritage sites, visitor centres, aquariums, and the public buildings on a university campus. The measured signals, arrivals, occupancy, dwell, and paths, are the same regardless of what is on display.


