
A busy station is one of the hardest public spaces to read by eye. Thousands of people move through a concourse in a few minutes when a train unloads, the space empties, then it fills again on the next arrival. Ticketing and gate-tap data tell an operator how many people bought travel, but they say little about how those people actually moved through the building: where they bunched up, which corridor ran close to its limit, and how long the platform approach stayed congested after the peak passed. Footfall measurement fills that gap. It counts people at the points inside the station where flow is decided, not only at the fare gate.
This post is about measuring footfall in rail, metro, and bus stations and the interchanges that connect them. It is deliberately not about airport passenger counting, which sits in its own body of work, and not about a stadium concourse on an event night. A public-transit station has a rhythm set by timetables and interchange patterns, and the way you count it follows from that rhythm. What the counts give an operator is an operations input: evidence for staffing, servicing, concession decisions, and for planning around known pressure points. They are a measurement layer that feeds those decisions, not a certified crowd-safety system in themselves.
How is footfall measured in a transit station?
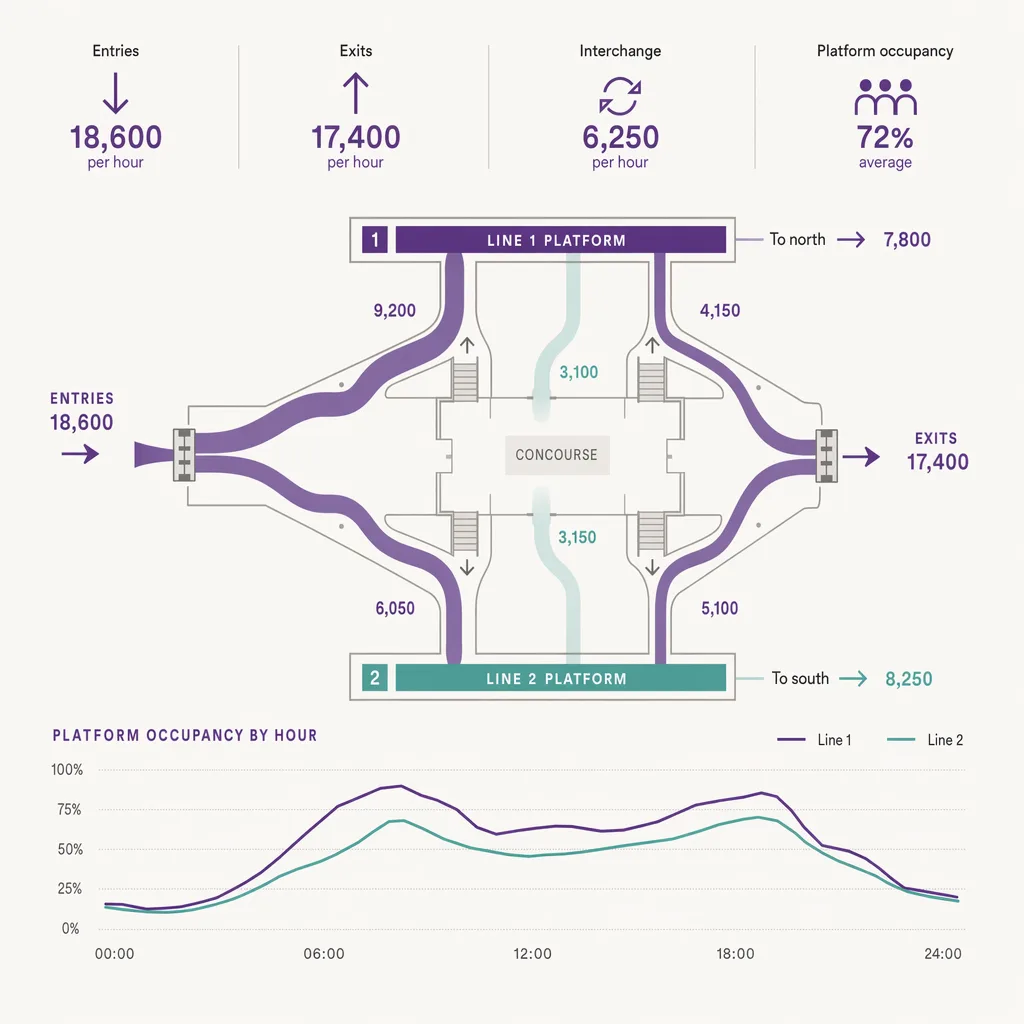
A station is measured at the choke points that define flow: entrances and exits, ticket lines and gatelines, platform approaches, and interchange corridors. Directional counting at these points shows not just how many people are present but which way they are moving, which is what reveals peak surges, counter-flow conflicts, and where a corridor is running near capacity. Station operators use the data for planning at peak, for siting and pricing concession space where dwell is highest, and for scheduling cleaning and staffing against real passenger patterns rather than a fixed timetable. The measurement records movement through space; how that evidence feeds safety and operational planning is a decision the operator owns.
The sections below walk the practical parts in turn: where in a station to place counting, what directional flow adds over a plain headcount, how a short-range forecast turns the counts into something you can act on before the surge lands, and how the same data supports the commercial side of a station without a single camera involved.
Where to count: entrances, gatelines, platform approaches, and interchange corridors
A station is not one space with one door. It is a sequence of connected spaces, each with its own load pattern, and a count taken at only one of them misreads the building. The useful counting points are the ones where flow narrows or splits.
Entrances and exits give the outer boundary: total people entering and leaving, and the split between street entrances when a station has several. Gatelines are the next natural line, and because almost everyone passes through them they are a strong point for a clean directional count. Platform approaches, the stairs, escalators, and passages that feed each platform, are where a train's worth of arrivals concentrates into a narrow space in seconds, so counting there shows the true peak the platform imposes on the concourse. Interchange corridors, the links between lines or between modes, are often the most congested part of a large station and the least visible in ticketing data, because a passenger changing lines may never tap a gate on the way through.
Placing counting at each of these lines, rather than only at the fare gate, is what lets an operator see the station as a flow network instead of a single turnstile total. The count at the gateline can be healthy while an interchange corridor two levels down is the actual constraint. Only measuring both tells you which one to plan around.
Directional flow and peak surges: reading movement, not just presence
A plain headcount answers "how many," which matters, but a station lives or dies on "which way, and when." Directional counting records the direction each person crosses a line, so the same corridor can be read as two separate flows: inbound and outbound. That distinction is where the operationally important patterns live.
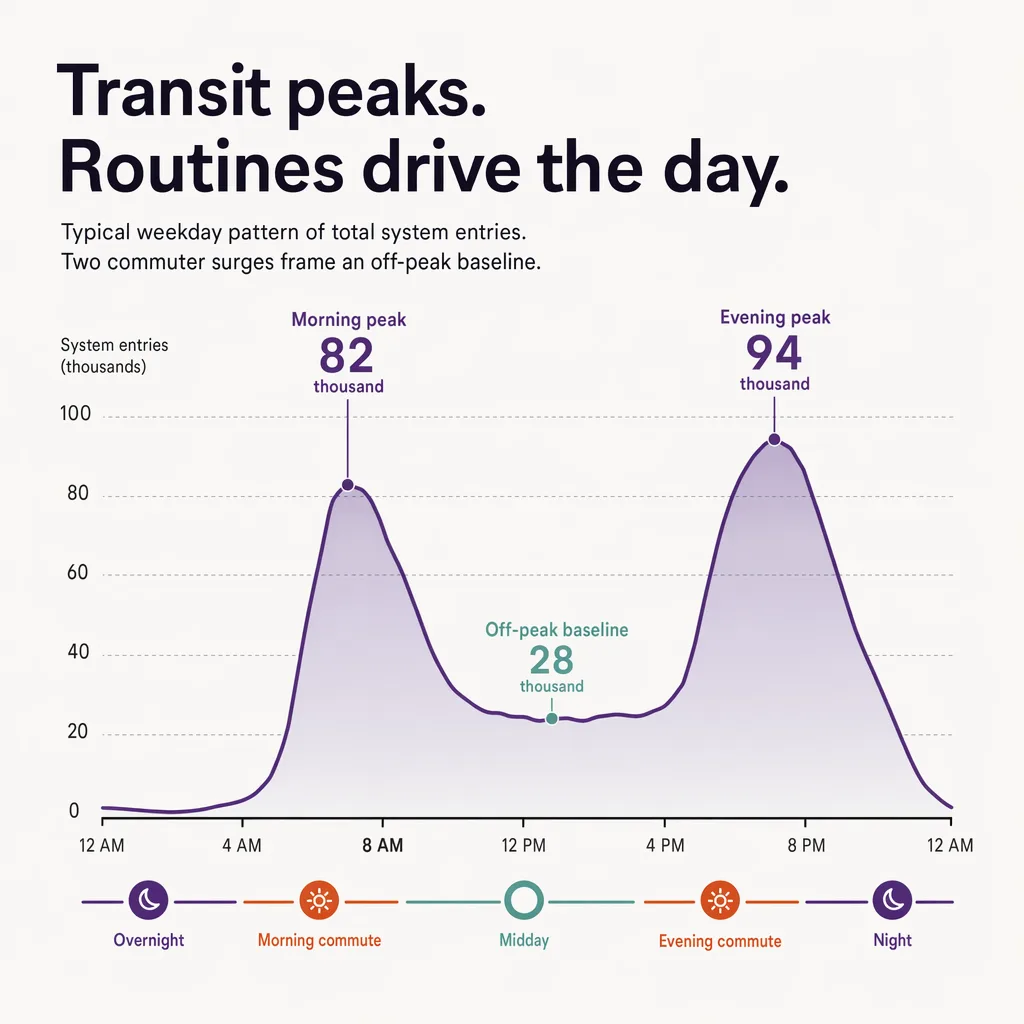
Peak surges are the clearest example. When a train unloads, a wave of arrivals hits the platform approach and the gateline within a minute or two, then fades. A daily total hides that wave completely; a directional, time-stamped count shows its shape, its height, and how long the corridor stayed loaded before it cleared. Counter-flow conflict is the other pattern directional counting exposes: a passage carrying heavy traffic in both directions at once behaves very differently from one carrying the same total in a single direction, and only a directional count tells them apart.
Reading these patterns as they happen, rather than in a report the next day, is where real-time people counting earns its place in a station. A live directional feed lets control staff see a surge building at an interchange and respond within the operator's own procedures, whether that means holding a gate, redirecting a flow, or moving staff to a pressure point. The measurement is an input to those procedures. It informs the people responsible for safe operation; it does not replace their judgement, their thresholds, or the trained response a station's safety plan defines.
Forecasting the next surge to staff ahead of it
Reading a surge as it lands is useful. Seeing it coming is better, because staffing and servicing decisions need lead time. A station's flow is unusually predictable in the short term: the timetable dictates when the next arrivals hit, and the counts from previous days and previous trains describe how large each wave tends to be at each point in the building.
That combination is what a short-horizon forecast uses. Feeding recent directional counts into a short-range surge forecast lets an operator anticipate the next few hours of load at each counting line, so staff and cleaning crews are in position before the pressure arrives rather than chasing it afterward. The value is in the lead time. A forecast that says a particular interchange corridor will load heavily in the next hour gives a duty manager room to act while there is still room to act, instead of reacting once the corridor is already full. As with live counting, the forecast is decision support for the operator's own plan, not an automated safety control.
Concession and retail siting inside the station
Footfall in a station is not only an operations question. Stations increasingly earn revenue from the retail and food concessions built into their concourses, and the value of a concession unit depends almost entirely on the flow past its door. A unit on a corridor that carries every arriving passenger is worth more than one tucked into a pocket that most people never pass, and footfall measurement is what turns that intuition into a number a landlord and a tenant can both see.
Directional, time-stamped counts show where people actually walk and where they slow down. A concourse position where passengers pause, waiting for a connection or checking a board, is commercially different from one they hurry through, because dwell is when a passing person becomes a possible customer. Measuring dwell alongside raw flow is what separates a high-traffic location from a high-value one.
There is a distinction worth keeping straight here, the same one that matters in any retail setting: the difference between raw footfall and the count of distinct people. A corridor that the same commuters pass twice a day inflates a raw crossing count without adding new potential customers, so reading unique visitors against raw footfall keeps concession valuations honest. For pricing a unit, the number of separate people exposed to it over a day matters as much as the number of crossings.
Counting a busy public concourse without cameras
A station concourse is exactly the kind of crowded public space where camera-based counting raises real objections. It is a place where the public has a reasonable expectation of privacy despite the crowds, where transport authorities face close scrutiny over surveillance, and where a large deployment of cameras dedicated to counting would be hard to justify to passengers. Counting the same flow without any camera at all removes that objection at the source.
Ariadne measures this with Hybrid Fusion, its patented camera-free method. Time-of-Flight depth sensing counts every visitor at the entrances, capturing geometry rather than images, while patented phone signal sensing follows movement through the interior, detecting the signals a phone emits even in airplane mode, and tracks that movement to about one-metre precision. The sensor streams both feeds to Ariadne, where Hybrid Fusion combines them into one trajectory per visit and computes counts, dwell, and paths. The streams carry no identifier: no MAC address, no device ID, no biometric data, and no camera is involved. Identifiers are stored only when a visitor explicitly opts in, which keeps the method GDPR-friendly and outside biometric territory.
For a station, two properties of that method matter beyond the privacy posture. Time-of-Flight measures distance rather than light, so it counts on a dim platform approach or an unlit night-time concourse as well as it does under full lighting. And because the depth sensing captures geometry rather than images, a heavily used gateline can be counted continuously without ever recording who passed through it. The result is a footfall layer an operator can run across an entire station, and across a network of stations, as a consistent measurement input for the planning, servicing, and commercial decisions above. For how station counting fits a wider municipal and transport programme, see smart-city analytics and the broader people counting approach.
A related open-space question, measuring occupancy where there is no doorway to count at, is covered in public-space occupancy, which sits alongside this post in the same cluster.
FAQ
How is footfall measured in a transit station?
At the choke points that define flow: entrances and exits, gatelines, platform approaches, and interchange corridors. Directional counting at these lines shows how many people are present and which way they are moving, which reveals peak surges, counter-flow, and corridors running near capacity. Operators use the data as an input to staffing, servicing, and concession decisions.
Do I need cameras to count footfall in a station?
No. Ariadne counts with Hybrid Fusion: Time-of-Flight depth sensing plus patented phone signal sensing, never cameras. Time-of-Flight captures geometry rather than images, and signal sensing captures no MAC address by default, so the measurement involves no video, no faces, and no biometric data.
What is directional flow and why does it matter in a station?
Directional flow records which way each person crosses a counting line, so a corridor can be read as separate inbound and outbound flows. It matters because a station's real pressure is about direction and timing, not just totals: a passage carrying heavy traffic in both directions at once behaves very differently from one carrying the same total one way.
Can footfall data manage crowd safety in a station?
Footfall data is an operations and planning input, not a certified crowd-safety system. Live and forecast counts help staff anticipate and respond to surges within the operator's own procedures and safety plan. The measurement informs the people responsible for safe operation; it does not replace their thresholds or trained response.
How does station footfall help concession revenue?
The value of a concession depends on the flow and dwell past its door. Directional, time-stamped counts show where passengers walk and where they slow down, and reading unique visitors against raw crossings keeps valuations honest, so a station can price and site retail against real exposure rather than a floor-plan guess.
---