
Retailers track labor cost as a percentage of sales, and they track how many staff are on the floor per shopper, but the number that sits between those two, labor hours measured against the volume of traffic they served, often goes uncalculated. That number is the labor-to-traffic ratio, and it is the most direct read on whether staffing is tracking demand rather than just tracking budget. It is also, unlike a percentage of sales, a metric you can point at the future: because traffic can be forecast, a target ratio becomes a scheduling input rather than only a month-end report.
This post defines the ratio, gives the formula and a worked, illustrative example, separates it cleanly from the two metrics it gets confused with, and shows how to use it to build a roster. It is a computed scheduling input with its own maths, which is what distinguishes it from the service-standard framing in staff-to-customer ratio; that sibling owns the floor-coverage view, and this post owns the labor-against-traffic calculation.
What is the labor-to-traffic ratio?
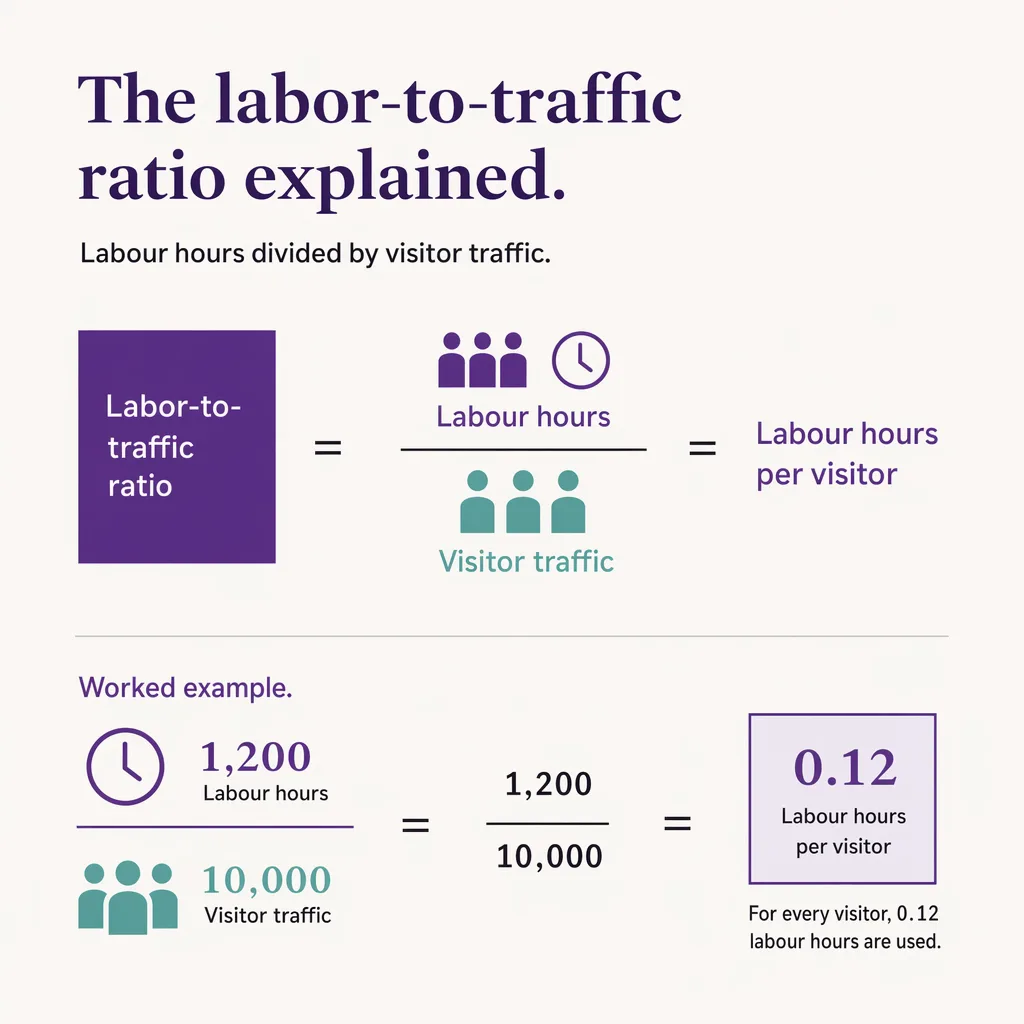
The labor-to-traffic ratio measures how many staff hours you spend against the volume of visitors you serve, usually expressed as visitors per labor hour or labor hours per hundred visitors. It tells you whether staffing is tracking demand hour by hour, not just whether the day was busy overall. You compute it by dividing measured entries in a period by the staff hours scheduled for that same period. Because it uses counted footfall rather than transactions, it captures the browsers and returners a sales-only view misses, which is why it works as a forward-looking scheduling input rather than only a backward-looking report.
The distinction that makes it useful is the denominator. Tie labor to sales and you can only judge staffing after the fact, once conversion has happened. Tie labor to traffic and you are measuring against demand as it arrived, which is a signal you can forecast and therefore schedule against.
The formula: visitors per labor hour and its inverse, worked example
The ratio has two equivalent forms, and it helps to keep both because they read naturally in different contexts.
Visitors per labor hour is the throughput form:
- Visitors per labor hour = measured entries in the period / staff hours in the same period.
Labor hours per hundred visitors is the intensity form, the same relationship inverted and scaled so the numbers sit in a readable range:
- Labor hours per 100 visitors = (staff hours / measured entries) x 100.
A worked example makes the mechanics concrete. The figures below are illustrative sample data, not a benchmark and not a customer result; use them to see the shape of the calculation, then substitute your own counts.
Take a single store hour. Suppose the entrance count records 180 visitors between 13:00 and 14:00, and four staff were scheduled on the floor for that hour, so 4 labor hours were spent. Visitors per labor hour is 180 / 4 = 45. The intensity form is (4 / 180) x 100 = about 2.2 labor hours per hundred visitors. Now compare the 10:00 hour in the same illustrative store: 40 visitors, three staff scheduled, so 3 labor hours. That is 40 / 3 = about 13 visitors per labor hour, and (3 / 40) x 100 = 7.5 labor hours per hundred visitors. The morning hour is spending more than three times the labor intensity of the lunch hour to serve a fraction of the traffic, which is exactly the kind of drift a daily total hides and the ratio exposes.
The unit you standardise on matters less than using it consistently. Pick visitors per labor hour or labor hours per hundred visitors, apply it the same way across dayparts and stores, and the ratio becomes comparable across the estate.
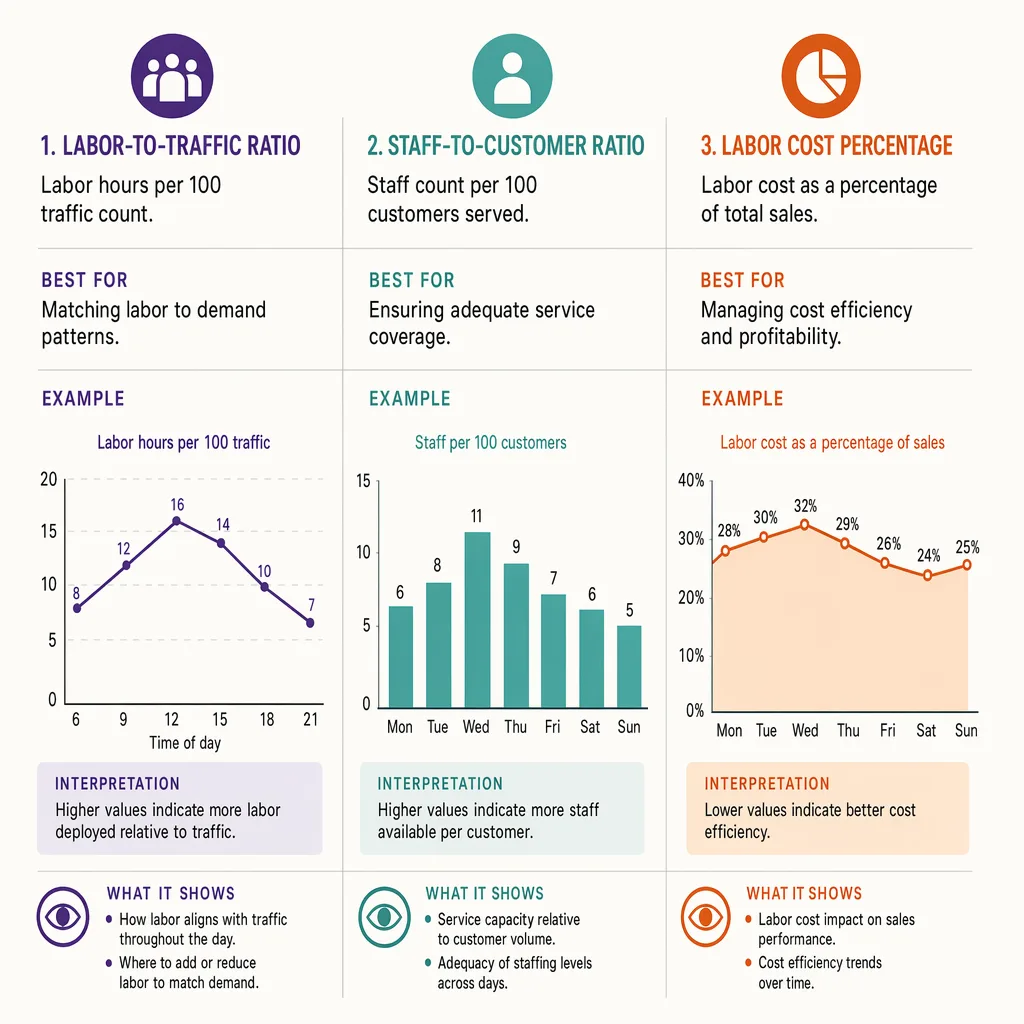
Ratio vs. staff-to-customer ratio vs. labor cost percentage: what each answers
Three metrics get used interchangeably and answer different questions. Keeping them apart is what stops a scheduling conversation going in circles.
| Metric | What it measures | Denominator | Best used for |
|---|---|---|---|
| Labor-to-traffic ratio | Staff hours against counted visitor volume | Measured entries | Forward-looking scheduling input; matching hours to demand by daypart |
| Staff-to-customer ratio | People on the floor per shopper present | Shoppers in-store at a moment | Service-quality standard; floor coverage and experience |
| Labor cost percentage | Labor spend against revenue | Sales | Budget and profitability control; month-end financial view |
The labor-to-traffic ratio is the only one of the three whose denominator can be forecast independently of what staff do, which is why it is the natural scheduling input. The staff-to-customer ratio is about how the floor feels to a shopper standing in it, a service standard rather than a scheduling formula. Labor cost as a percentage of sales is the financial control that tells you whether the whole labor line is affordable, but it can only judge staffing after conversion has happened. Use all three: the traffic ratio to plan the roster, the staff-to-customer ratio to set the service target it aims at, and labor cost percentage to check the plan against the budget.
Where the traffic number comes from, and why counted footfall beats transaction counts
The ratio is only as good as its denominator, and this is where many attempts fall down. If the traffic number comes from transactions, or from a rough estimate, the ratio inherits that error and stops being a reliable input.
Ariadne measures this with Hybrid Fusion, its patented camera-free method. Time-of-Flight depth sensing counts every visitor at the entrances, capturing geometry rather than images, while patented phone signal sensing follows movement through the interior, detecting the signals a phone emits even in airplane mode, and tracks that movement to about one-metre precision. The sensor streams both feeds to Ariadne, where Hybrid Fusion combines them into one trajectory per visit and computes counts, dwell, and paths. The streams carry no identifier: no MAC address, no device ID, no biometric data, and no camera is involved. Identifiers are stored only when a visitor explicitly opts in, which keeps the method GDPR-friendly and outside biometric territory.
Counted footfall beats a transaction count as the denominator for one plain reason: it includes everyone who created work, not only those who bought. A store that converts one visitor in five is doing four-fifths of its service work for people who never appear in a transaction log. Sizing labor against transactions therefore under-counts demand by design, and it under-counts it most in exactly the browsing-heavy hours where good staffing changes the conversion outcome. An entrance count taken with accurate footfall counts puts the real demand in the denominator, so the ratio reflects the workload the store actually faced.
Using the ratio as a scheduling INPUT: set a target per daypart, then roster to hit it
The ratio earns its keep when you run it forward. Instead of reporting last week's visitors per labor hour, set a target visitors-per-labor-hour figure for each daypart, forecast the traffic, and solve for the hours that hit the target.
The steps are short. First, agree a target ratio per daypart that delivers the service level you want, informed by the staff-to-customer standard you are aiming for. Peak hours usually carry a lower visitors-per-labor-hour target, because service degrades faster when a queue forms; quiet hours can run leaner. Second, forecast arrivals for each daypart. Third, divide the forecast by the target ratio to get required staff hours, then build shifts to that shape. This is the same demand-to-hours translation that underpins rostering to demand, with the ratio as the explicit conversion factor.
Dayparting the target is what stops a single blended ratio from mis-staffing both ends of the day. A store that applies one all-day figure over-covers the lunch-hour traffic surge or, more often, under-covers it while parking spare hours in the quiet stretches. Setting the target per daypart forces the roster to bend to the traffic curve rather than flatten it.
Reading the ratio: over-staffed troughs, under-staffed peaks, and the conversion cost of getting it wrong
Once the ratio is running, reading it well is a skill in itself, because a number that is off in one direction costs money differently from a number off the other way.
A ratio that is too low in a trough, few visitors per labor hour, means over-staffing: hours are being spent on demand that is not there, and the cost lands straight on the labor line with nothing to show for it. This is the easier error to spot and the easier to fix, because trimming a lightly attended hour rarely hurts sales.
A ratio that is too high at peak, many visitors per labor hour, is the expensive error, and it hides. Under-staffing a busy hour does not show up as a cost; it shows up as an absence, the sale that did not happen because a queue was too long, a fitting room stayed shut, or a question went unanswered. That is a hit to conversion rate, and because the lost visitor simply leaves, nothing in the sales report flags it. The traffic ratio is often the only place the problem is visible before it becomes a trend, which is why watching it at peak matters more than watching the daily average.
The practical read, then, is to judge the ratio daypart by daypart against its target, not as a single number for the day. Troughs running below target are a signal to trim; peaks running above target are a signal to add cover before the conversion cost accumulates. Managed that way, the labor-to-traffic ratio stops being a report and becomes the dial that keeps traffic-driven scheduling honest, matching hours to the demand that counted footfall can actually measure.


