
There is a comfortable assumption behind a lot of retail planning: get more people through the door and the tills will follow. Sometimes they do. Often they do not, and a store that chased footfall all quarter ends up with a busier floor and a flatter average basket than it started with. The reason is that footfall and basket size are not the same lever, and they are not even connected in the way most people expect. One counts how many people came in. The other measures what each buyer actually bought. Push hard on the first and you can easily drag the second down.
This post keeps the two metrics apart on purpose, because that separation is where the useful reading lives. It defines footfall and basket size cleanly, walks the four patterns you get when you cross them, shows where conversion rate sits in between, and covers how promotions and weather distort the relationship. It closes on the measurement the whole analysis depends on: an accurate, calibrated entry count you can trust against your point-of-sale data. For the single blended ratio that folds spend and traffic together, see sales per visitor; this post deliberately does not blend them.
Does more footfall mean a bigger basket size?
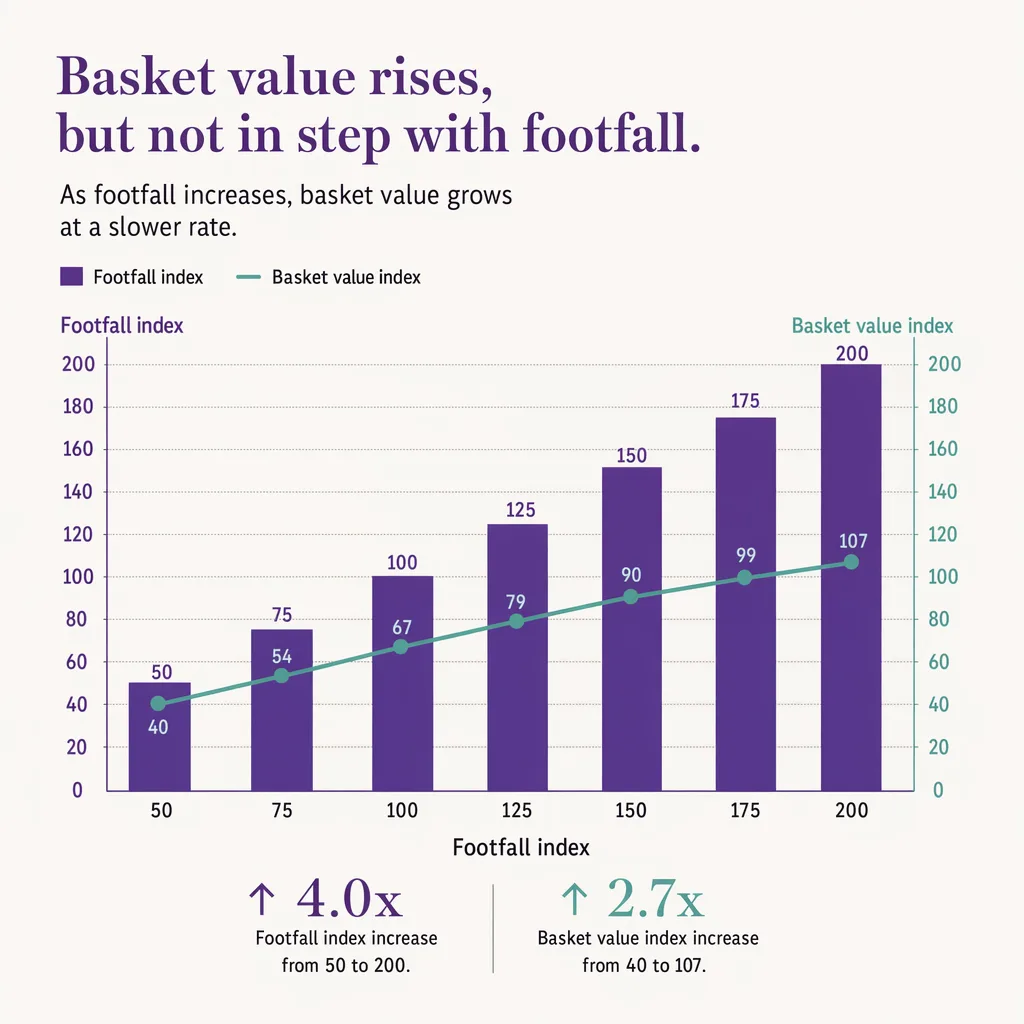
Not usually. Footfall and basket size move on different levers, and they often pull in opposite directions. Footfall counts how many people entered; basket size (average transaction value, or units per transaction) measures how much each buyer bought once inside. A busy day can flood the store with browsers who buy little, dragging average basket down even as traffic climbs, while a quiet, high-intent day can lift it. Reading the two together, alongside conversion rate, tells you whether a traffic gain is real revenue or just crowding. To do that you need an accurate entry count paired with point-of-sale data, not one or the other.
Two different metrics: footfall (entries) versus basket size
Footfall is a count of people. It answers one question, how many visitors crossed the threshold in a given period, and it says nothing about what any of them did afterwards. It is a top-of-funnel number: the raw size of the audience your store had a chance to sell to. A footfall figure is only as good as the counting method behind it, but conceptually it is simple, and it is the same whether a visitor bought a full trolley or turned around and left.
Basket size is a very different kind of number, because it is measured only over people who actually transacted. Average transaction value (ATV) is total sales divided by the number of transactions. Units per transaction (UPT) is total items sold divided by transactions. Both describe the buyer, not the visitor. A shopper who never reaches the till does not appear in either figure. That single fact is why footfall and basket size can move independently: they are computed over different populations. Footfall is everyone who entered. Basket size is only the subset who bought.
Once you see them as two populations rather than one funnel, the intuition that "more people means more spending per head" falls apart. Adding a hundred browsers to the top of the funnel changes footfall immediately and changes basket size not at all, unless some of those browsers convert, and if they convert into small, low-value purchases they can actually pull the average basket down.
The four combinations, and what each pattern is telling you
Because the two metrics move independently, the honest way to read them is together, as a grid. Cross high and low footfall with high and low basket size and you get four situations, each pointing at a different cause and a different action.
| Footfall | Basket size | Likely cause | What to do |
|---|---|---|---|
| High | High | A genuinely strong day: high-intent traffic and a mix that encourages larger purchases | Protect what is working; note the source of the traffic so you can repeat it |
| High | Low | A browser flood: a promotion, an event, or weather pulled in volume with low buying intent, or heavy discounting shrank each basket | Check conversion rate and staff coverage; decide whether the traffic was worth its margin |
| Low | High | A quiet but committed day: fewer visitors, but the ones who came arrived to buy | Ask whether marketing is reaching enough of these high-intent shoppers to scale the pattern |
| Low | Low | A weak day on both counts: a demand or offer problem, not a crowding problem | Investigate the traffic source and the offer itself before touching staffing |
The pattern that trips people up most is the high-footfall, low-basket cell, because it looks like success from the door and reads like failure at the till. A deep discount or a viral moment can pack a store with people who buy one marked-down item each, and the daily footfall record hides the fact that margin per visitor collapsed. The grid forces you to ask the second question the raw count never does: were these the right people, or just more people.
Where conversion rate sits between the two
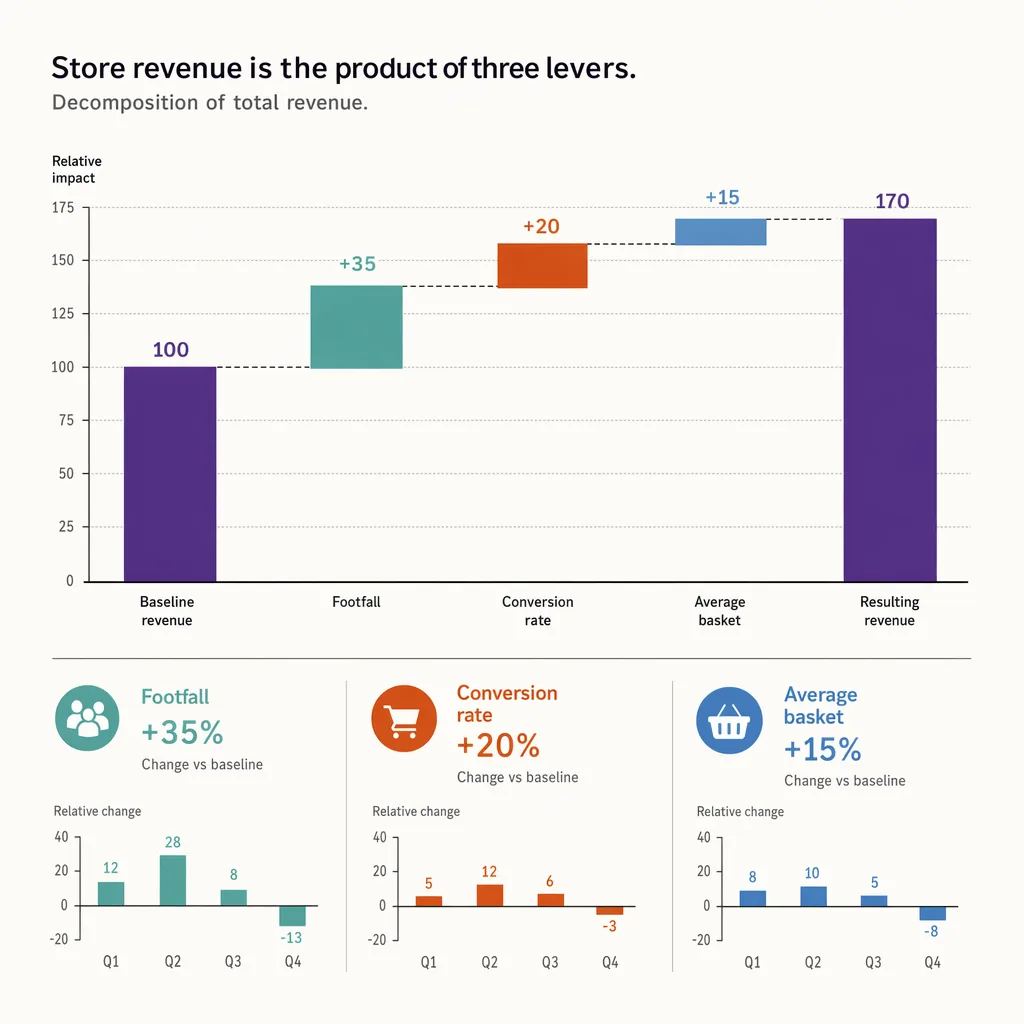
Footfall and basket size sit at opposite ends of a chain, and conversion rate is the link in the middle. Conversion rate is the share of visitors who become buyers: transactions divided by entries. It is the bridge that explains how a change in footfall does or does not reach basket size. The full definition and calculation live in the conversion rate formula; the point here is only where it fits.
Read the chain in order. Footfall sets how many people you had. Conversion rate sets how many of them bought. Basket size sets how much each buyer spent. Multiply the three and you get revenue, which is why looking at any one of them alone is misleading. A footfall gain that arrives with a lower conversion rate and a smaller basket can leave revenue flat or worse. A footfall gain that holds conversion and basket steady is real growth. You cannot tell which you have from the traffic number by itself.
This is also why sales per visitor is a useful companion metric but not a replacement for reading the parts. Sales per visitor collapses conversion and basket into a single spend-per-entry figure, which is efficient for tracking but hides whether a change came from more people buying or from each buyer spending more. Keeping conversion rate and basket size separate tells you which lever actually moved.
Reading them together: the traffic-quality question promotions and weather raise
The moment you accept that footfall and basket size are separate populations, a sharper question replaces "how do we get more people in": what kind of traffic are we getting, and is it worth it. Two forces make this question unavoidable, because both change traffic volume without changing intent in the same direction.
Promotions are the clearest case. A steep price cut reliably lifts footfall, and it just as reliably compresses basket size, because the offer both attracts deal-seekers and shrinks the value of what they buy. That is not automatically bad. A loss-leader that pulls in shoppers who then add full-price items to the basket can be a win. But you only know which happened if you watch footfall, conversion, and basket together across the promotion, rather than celebrating the traffic spike on its own. The relationship between traffic and total takings is its own subject; see how footfall correlates with revenue for the revenue side of the same question.
Weather does something similar for free. A sunny Saturday on a high street lifts passing traffic and store entries, but a good share of that lift is low-intent strolling rather than planned buying, so basket size can soften even as footfall climbs. A wet weekday can do the reverse: fewer people, but the ones who came out did so on purpose. Reading basket size against these weather-driven traffic swings stops you from crediting or blaming the store for a pattern the sky produced. The same logic applies within a single day, where the busiest hour and the best-buying hour are frequently not the same; see conversion by hour of day for that intraday view.
Measuring the entry count basket analysis depends on
Every reading above rests on one thing being trustworthy: the entry count. Basket size comes straight from the point-of-sale system and is rarely in doubt. Footfall is the number that goes wrong, and when it does, the whole comparison rots. If the door count over-reads by counting staff, prams, and re-entries as new visitors, conversion rate looks artificially low and every basket-versus-traffic judgement is built on sand. The analysis is only as good as the count feeding it, so the count has to be accurate and calibrated, not a rough estimate from a doorway sensor no one has checked in a year.
Ariadne measures this with Hybrid Fusion, its patented camera-free method. Time-of-Flight depth sensing counts every visitor at the entrances, capturing geometry rather than images, while patented phone signal sensing follows movement through the interior, detecting the signals a phone emits even in airplane mode, and tracks that movement to about one-metre precision. The sensor streams both feeds to Ariadne, where Hybrid Fusion combines them into one trajectory per visit and computes counts, dwell, and paths. The streams carry no identifier: no MAC address, no device ID, no biometric data, and no camera is involved. Identifiers are stored only when a visitor explicitly opts in, which keeps the method GDPR-friendly and outside biometric territory.
Paired with your point-of-sale data, a calibrated entry count turns the four-cell grid from a hunch into a measurement. You can see, day by day and promotion by promotion, whether a traffic gain carried conversion and basket with it or left them behind. That is the difference between managing footfall as a vanity number and managing it as one input into revenue. For the counting method behind it, see accurate people counting.
FAQ
Does higher footfall increase average basket size?
Not on its own. Footfall counts everyone who enters; basket size is measured only over people who actually buy. Adding more visitors, especially low-intent ones drawn by a discount or good weather, can lift footfall while leaving basket size flat or pulling it down. The two move on different levers, so a traffic gain only reaches basket size if those extra visitors convert into meaningful purchases.
What is the difference between basket size and sales per visitor?
Basket size (average transaction value or units per transaction) is measured only over buyers: it describes what each purchasing shopper spent. Sales per visitor spreads total sales across every entry, buyers and non-buyers alike, so it blends conversion rate and basket size into one figure. Basket size answers "how much did each buyer spend"; sales per visitor answers "how much did each visitor generate".
Why did my basket size drop when footfall went up?
The most common cause is traffic quality. A promotion, an event, or a sunny day can flood the store with browsers and deal-seekers who buy little or buy only the discounted item, which drags the average basket down even as the door count rises. Check conversion rate and the source of the extra traffic before treating the basket drop as a store problem.
Do I need cameras to measure footfall for basket analysis?
No. Ariadne counts with Hybrid Fusion: Time-of-Flight depth sensing plus patented phone signal sensing, never cameras. Time-of-Flight captures geometry rather than images, and signal sensing captures no MAC address by default, so the measurement involves no video, no faces, and no biometric data.
How do I read footfall and basket size together?
Cross high and low footfall with high and low basket size to get four patterns, then bring in conversion rate to explain the middle. High traffic with a low basket usually means a browser flood; low traffic with a high basket means fewer but committed buyers. Multiplying footfall, conversion rate, and basket size gives revenue, which is why no single one of the three should be read alone.
---