
Retail media networks have a lopsided story to tell. On the e-commerce side they can trace an on-site ad to a click to a basket to a purchase, and hand a brand an attribution report that closes the loop. On the in-store side, where the screens and displays live, the same network often falls back to a delivery number: the content played this many times on this many screens for this many hours. That is a proof of playout, not a proof that anyone in the aisle noticed. Brands paying for in-store inventory increasingly know the difference, and they are asking the network to prove the placement moved people.
Footfall attribution is how you answer that, and it is the subject of this post: what footfall and dwell actually prove for an in-store placement, where this sits next to the attribution work retail media already does, and how to do it without stepping over the privacy line. It stays specifically on retail-media-network in-store inventory. For the programmatic-buying angle see programmatic DOOH attribution, and for campaign-wide measurement across a center see mall marketing attribution.
How does footfall attribution work for retail media networks?
Retail media networks sell in-store screens and displays to brands, and those brands want proof the placement moved people, not just impressions on a server log. Footfall attribution answers that by measuring how many people passed the screen, how long they lingered near it, and how store traffic to that zone changed while a campaign ran. Ariadne measures this camera-free: it counts visitors and captures dwell in front of a placement without recording who anyone is, so a retail media network can report verified presence and engagement rather than a modelled estimate. That gives the network a defensible attribution story for the in-store half of its inventory, one that holds up under GDPR because there is no personal data to defend in the first place.
The in-store measurement gap RMNs have
The gap is structural, and it comes from where retail media grew up. The category was born online, where every surface is instrumented and every exposure is logged against an identifiable session. Carry that expectation into the physical store and it breaks, because the store was never wired for it. The screen knows what it played and when, and that is roughly the limit of what the media stack captures unaided. Whether a shopper glanced at it, slowed down, or walked past oblivious is invisible to the playout log.
So the network reports what it has, which is delivery. A brand reads "12,000 plays across 40 screens" and is left to assume some fraction of those plays reached a human who was looking. That assumption is exactly what a sophisticated advertiser refuses to fund, because it is the same leap of faith that outdoor advertising spent two decades trying to retire. The in-store half of a retail media network is often its most differentiated inventory, closest to the point of purchase, and it is being sold on the weakest measurement. Closing that gap is not a reporting nicety, it is what lets the network charge for the in-store surface with the same confidence it charges for the on-site one.
What footfall and dwell actually prove for a placement
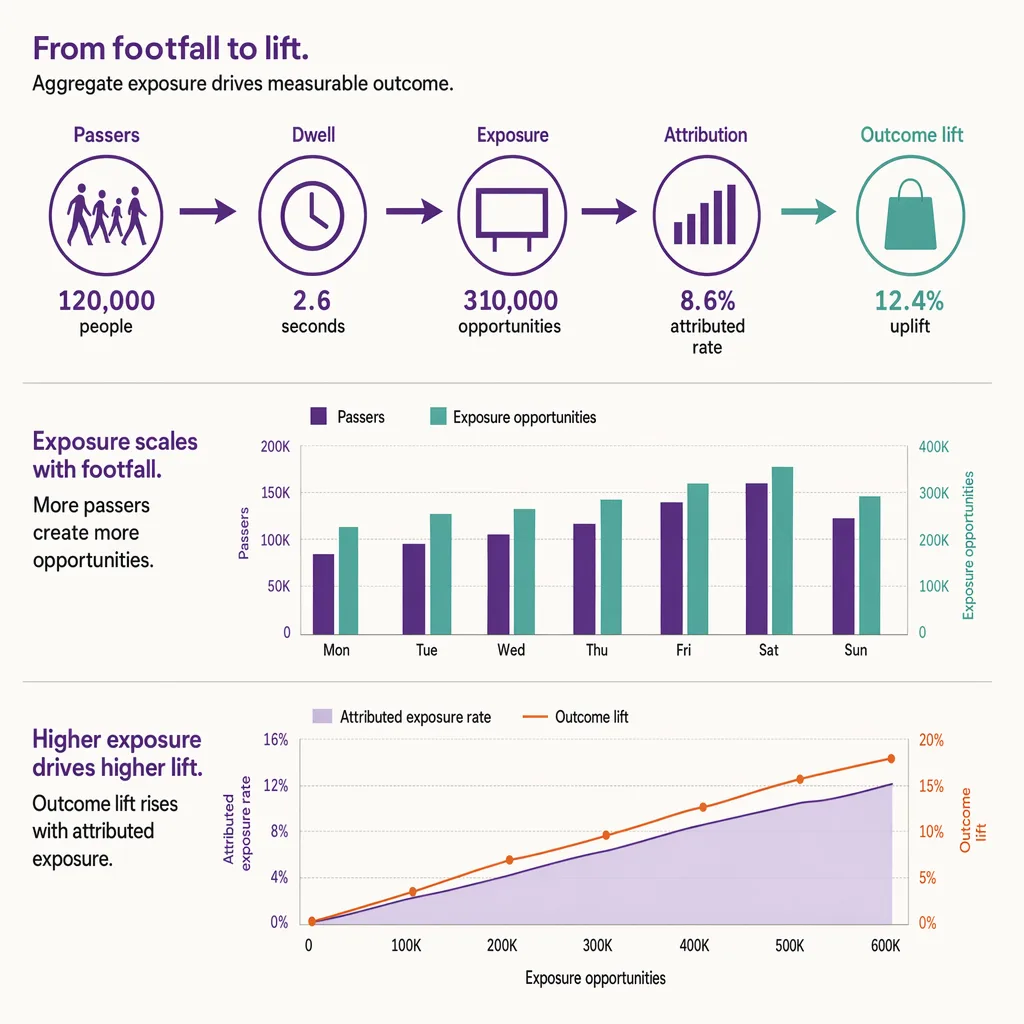
Three measured signals turn a placement from a delivery number into an evidenced one, and each answers a different brand question.
- Passers. How many people physically moved through the zone the screen serves while the content ran. This is the honest denominator, the real opportunity-to-see, replacing the guess baked into a raw plays figure.
- Dwell. How long people lingered in front of, or beside, the placement. A screen that holds attention for a few seconds is doing work; one that everybody walks straight past is not, however many times it played. Dwell time at a screen is the engagement metric that separates a noticed placement from an ignored one.
- Zone traffic shift. How footfall to the promoted zone or product changed while the campaign was live compared with a baseline. This is the closest in-store analogue to a lift metric: did the placement pull more people toward the thing it was promoting.
Put together, these three move the conversation from "the content played" to "this many people were present, this many engaged, and traffic to the promoted zone changed by this much." That is a report a brand can act on, and it is built entirely from counting and timing, no identity required. For the broader picture of what a screen network can measure, see analytics for digital signage.
Presence and dwell, not profiles: what Ariadne measures and what it deliberately does not
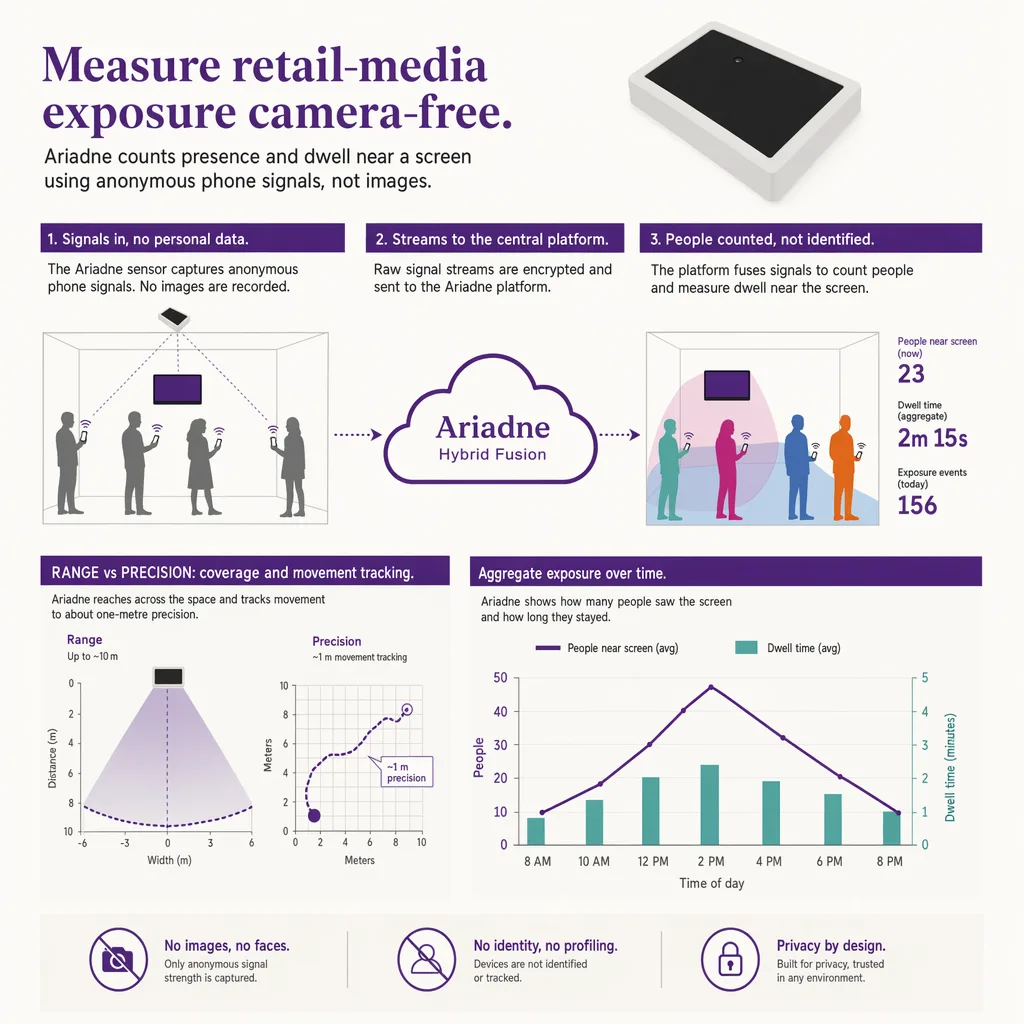
This is the line that keeps the whole approach defensible, and it is worth stating without hedging. Ariadne sizes an in-store audience by measuring presence and dwell. It counts how many people were there and how long they lingered. It does not detect faces, it does not estimate age or gender, and it does not build a demographic profile of who walked past the screen. That is not a gap in the product, it is the design. A retail media network that reports verified presence and engagement is standing on ground that holds under GDPR and the EU AI Act, because there is no biometric capture and no personal data at the point of measurement to challenge.
Where a brand arrives expecting demographic audience profiles, the honest answer is to state plainly what is measured instead and why it is stronger, not weaker. Verified presence and dwell is a count of real people in a real place, not a modelled inference about who they probably were. It is auditable, it is repeatable, and it does not carry the regulatory and reputational risk that face-based audience analytics now attracts. For the full privacy stance on this, see measuring screens without facial recognition.
Ariadne measures this with Hybrid Fusion, its patented camera-free method. Time-of-Flight depth sensing counts every visitor at the entrances, capturing geometry rather than images, while patented phone signal sensing follows movement through the interior, detecting the signals a phone emits even in airplane mode, and tracks that movement to about one-metre precision. The sensor streams both feeds to Ariadne, where Hybrid Fusion combines them into one trajectory per visit and computes counts, dwell, and paths. The streams carry no identifier: no MAC address, no device ID, no biometric data, and no camera is involved. Identifiers are stored only when a visitor explicitly opts in, which keeps the method GDPR-friendly and outside biometric territory.
Attribution vs impression counting vs programmatic reporting: what each layer covers
Retail media buyers hear "attribution", "impressions", and "programmatic reporting" used loosely, and the three cover different jobs. The table separates them so a network can say precisely which one footfall attribution provides.
| Layer | Core question | What it counts | What it cannot tell you alone |
|---|---|---|---|
| Impression counting | Did the content play? | Playouts, screens, hours of delivery | Whether any person was present or engaged |
| Footfall attribution | Did the placement reach and move people? | Passers, dwell, zone traffic shift, all camera-free | Who the individuals were (by design, not by limitation) |
| Programmatic reporting | Was the buy delivered as traded? | Bids, wins, spend, delivery pacing across the network | On-the-ground presence and engagement at the screen |
Impression counting is the delivery receipt: necessary, but silent on whether anyone saw the content. Programmatic reporting governs how the inventory was bought and delivered across a network, which is the territory programmatic DOOH attribution covers in depth. Footfall attribution is the middle layer that neither of the others supplies: hard evidence that real people were present and engaged at the placement. For attribution stretched across a whole center rather than a single network's inventory, see mall marketing attribution. The three are complementary, and a mature in-store retail media report uses all three rather than passing one off as another.
Building the in-store attribution report a brand will accept
A report a brand will accept has a shape, and the illustrative structure below shows it. Treat the numbers as a sample layout, not a result: replace them with your own measured counts.
Start with the baseline. Measure passers, dwell, and zone traffic for the placement over a representative period before the campaign runs, so you have something honest to compare against. Then run the campaign and measure the same three signals the same way. The report states, for example, that the zone saw a sample 6,400 passers over the campaign window against a baseline of 5,900, that average dwell at the placement was a sample 9 seconds against a 6-second baseline, and that traffic to the promoted product zone rose against its own prior period. Every figure here is illustrative and exists to show the format; the point is the structure, a like-for-like before-and-after on measured presence and engagement.
Two disciplines make the report credible rather than flattering. First, hold the comparison method constant: the baseline and the campaign period must be measured with the same instrument over comparable days, or the difference is an argument about methodology instead of a result. Second, label what the number is and is not. It is verified presence and engagement at the placement. It is not a demographic profile, and it is not a claim that every passer converted. A network that reports within those bounds gives the brand something durable, and it is the in-store proof that lets the network sell its most valuable surface on evidence rather than assumption. See in-store digital signage analytics for how this measurement fits the wider screen program, and camera-free people counting for the counting method underneath it.
FAQ
How does footfall attribution work for a retail media network?
It measures three things at each in-store placement: how many people passed the zone, how long they lingered near the screen, and how traffic to the promoted zone changed while the campaign ran, compared with a baseline. That turns a delivery log ("the content played") into evidence that real people were present and engaged, which is the proof a brand buying in-store inventory actually wants.
Does footfall attribution identify who saw the screen?
No, and that is deliberate. Ariadne measures presence and dwell, how many people were there and how long they lingered, not who they were. There is no face detection, no age or gender estimation, and no demographic profiling. The report is a count of real people in a real place, which is auditable and holds up under GDPR and the EU AI Act.
Do I need cameras to measure in-store retail media audiences?
No. Ariadne counts with Hybrid Fusion: Time-of-Flight depth sensing plus patented phone signal sensing, never cameras. Time-of-Flight captures geometry rather than images, and signal sensing captures no MAC address by default, so the measurement involves no video, no faces, and no biometric data.
How is this different from impression counting?
Impression counting reports that content played on a screen for a period. It says nothing about whether a person was present or paid attention. Footfall attribution adds the missing layer: measured passers, dwell, and zone traffic shift, so a plays figure becomes an evidenced reach-and-engagement figure. A complete in-store report uses both, plus programmatic delivery reporting, rather than treating one as a substitute for the others.
What can I claim in a report a brand will accept?
Claim verified presence and engagement: passers, dwell, and zone traffic shift, measured the same way before and during the campaign. Do not claim demographic profiles or that every passer converted. Keeping the report inside what was actually measured is what makes it defensible, and a defensible in-store number is what lets a retail media network charge for its aisle-level inventory with confidence.