
What is dwell time, and why does it lead conversion?
Dwell time is the average time a visitor spends inside a space. In a shopping centre it is more than a comfort metric: it is a leading indicator. When average dwell time falls, conversion tends to follow in the next quarterly cycle, which gives operators a window to act before the drop reaches tenant sales reports.
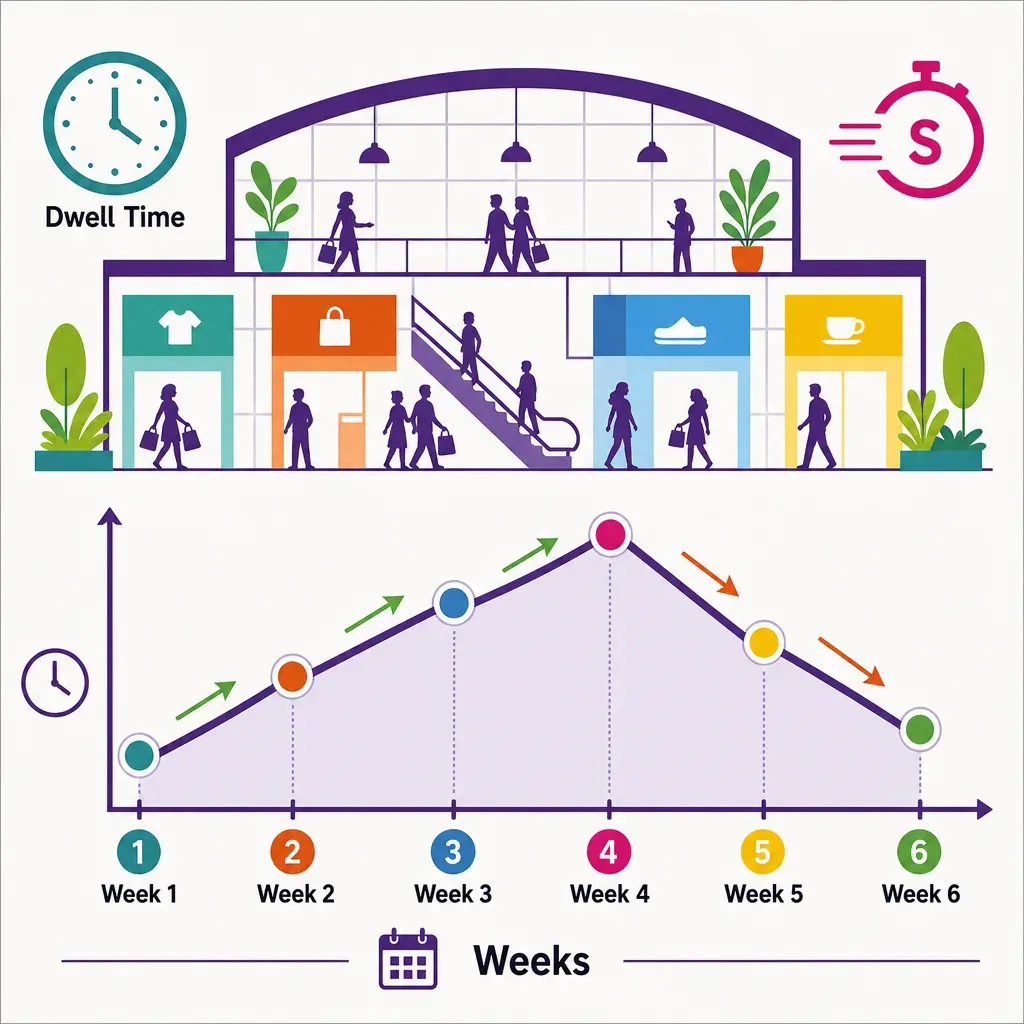
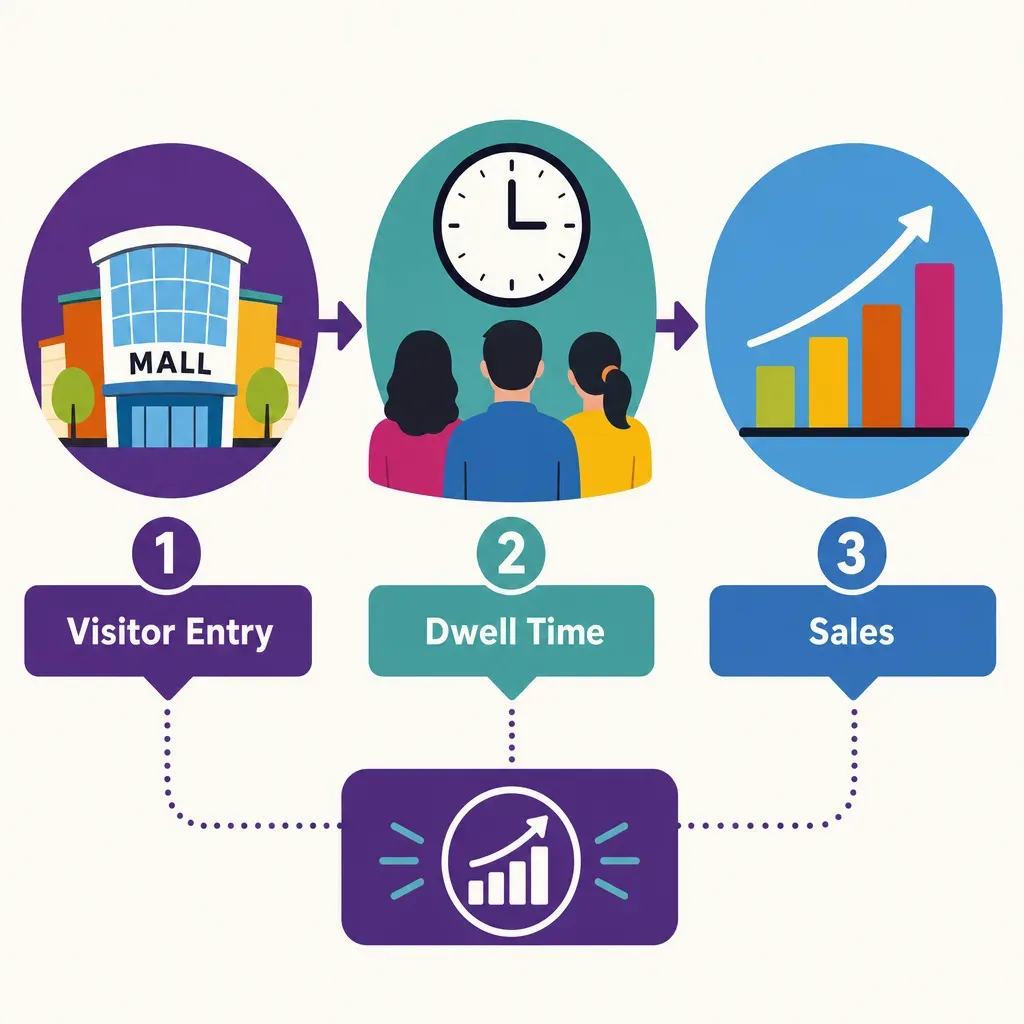
In six weeks of data across a panel of European centres, dwell time correlated with revenue per visit far more strongly (r = 0.71) than entry counts did (r = 0.43). In plain terms: how long people stay predicts what a centre earns per visit better than how many people walk in. That is why footfall alone is a weak health signal, and why dwell time deserves a place on the operator dashboard alongside anchor tenant economics.
Footfall is also worth separating from the proxies operators often lean on. It is not the same as parking utilisation, and it reads as an early warning against mall vacancy, both of which a raw entry count alone will miss.
How we measured it
The figures above come from six weeks of dwell-time data across a panel of European shopping centres. Ariadne measures this with Hybrid Fusion, its patented camera-free method. Time-of-Flight depth sensing counts every visitor at the entrances, capturing geometry rather than images, while patented phone signal sensing follows movement through the interior, detecting the signals a phone emits even in airplane mode. The sensor streams both feeds to Ariadne, where Hybrid Fusion combines them into one trajectory per visit and computes counts, dwell, and paths. The streams carry no identifier: no MAC address, no device ID, no biometric data, and no camera is involved. Identifiers are stored only when a visitor explicitly opts in, which keeps the method GDPR-friendly and outside biometric territory.
Dwell time per visit comes from that fused trajectory: the time between a visitor's entry and exit. It was then compared against each centre's revenue-per-visit and entry-count series over the same window. The headline relationship is a correlation, not a controlled experiment, so read it as a strong signal rather than proof of cause. The Limitations section below is honest about what a six-week, single-region window can and cannot show.
The headline finding: dwell tracks revenue better than footfall
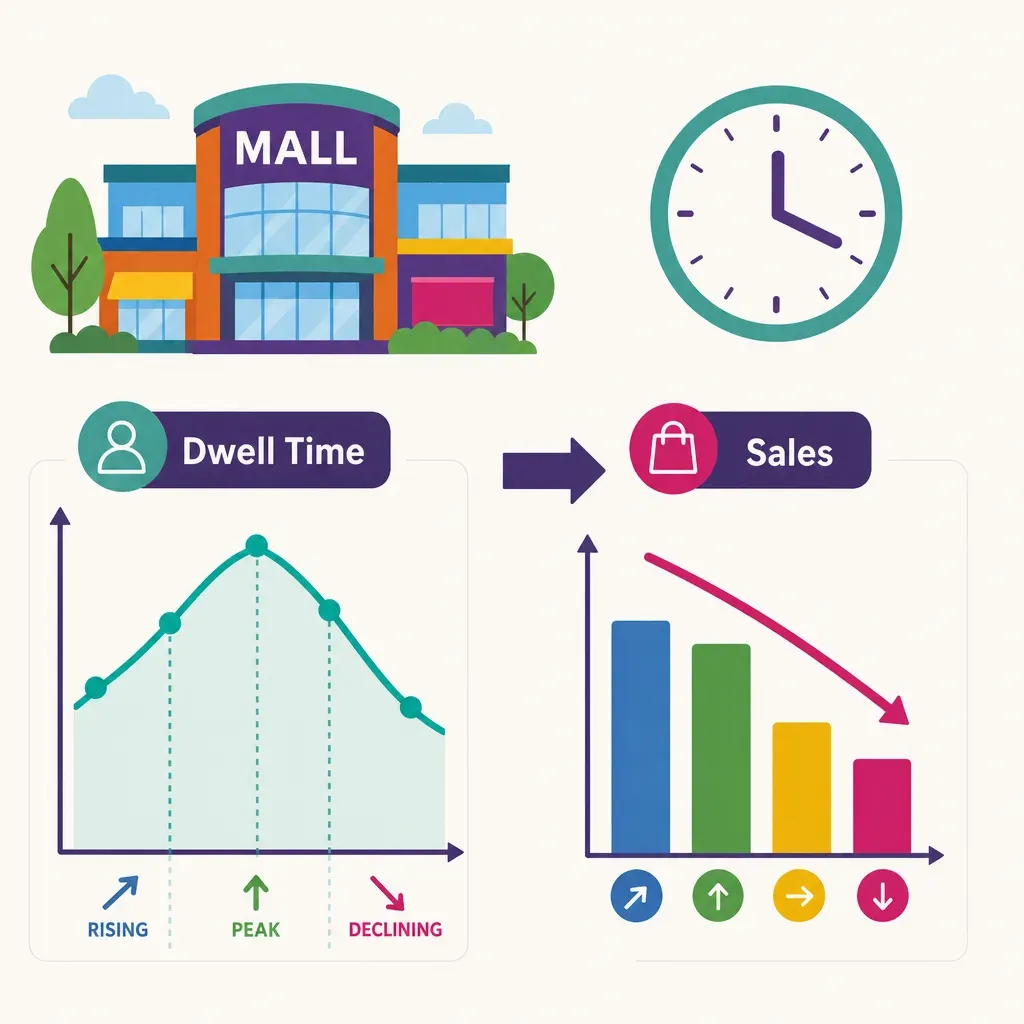
Across the panel, dwell time correlated with revenue per visit at r = 0.71, while entry counts correlated at r = 0.43. Both matter, but the gap is the point: a centre can hold its footfall steady and still lose revenue if visits get shorter. Shorter visits mean fewer store entries per trip, fewer considered purchases, and less exposure to food and beverage and experiential tenants.
The practical reading: treat a sustained dwell-time decline as an early warning. Because it shows up roughly four to six weeks before the conversion drop lands in tenant sales reports, a centre that watches dwell can intervene on layout, tenant mix, or events while there is still time to change the quarter.
Reading dwell time by time of day
Absolute dwell numbers matter less than how the daily shape moves. A few patterns operators watch, read here as directional rather than fixed benchmarks:
- Morning. Shorter, mission-driven visits dominate. A morning that lengthens often signals leisure or F&B pulling early dwell.
- Lunch. A dwell peak driven by food and beverage. If lunch dwell flattens, check F&B availability and queue times before blaming footfall.
- After-school. A distinct bump in family and teen dwell. Sensitive to seating, safety perception, and experiential tenants.
- Evening. Longer, social visits. Evening dwell erosion is often the first sign of an experiential or F&B gap, well before sales show it.
Dwell time by tenant type
Dwell is not evenly created. Tenant mix shapes it, so a centre's dwell trend is partly a verdict on its leasing strategy:
- Anchors. Department-style and experiential anchors lengthen dwell and pull visitors deeper into the centre.
- Junior anchors. Mid-box tenants extend dwell when clustered well and shorten it when isolated at dead ends.
- In-line stores. Transactional in-line units add shorter, focused dwell; their value is conversion density, not duration.
- Food and beverage. The strongest single lever on dwell. F&B is why dwell and revenue per visit move together, and why a weak F&B offer caps a centre's dwell ceiling.
How operators use dwell as a leading indicator
Centres that treat dwell as an early-warning metric run a simple loop: watch the trend, find the cause, act before sales confirm it. In practice that means:
- Flag the decline early. A multi-week dwell slide is the trigger, not a single soft week.
- Localise it. Break dwell down by time of day, zone, and tenant cluster to find where minutes are being lost.
- Act on the lever. Adjust events, seating, wayfinding, or tenant adjacencies, then watch whether dwell recovers ahead of the next sales cycle.
Reading dwell alongside a heatmap interpretation playbook turns the trend into a map: not just that dwell fell, but in which zones and lanes it fell, so the fix is targeted instead of centre-wide guesswork.
How to instrument dwell time without collecting personal data
Dwell time comes from the fused trajectory, not from identity. Time-of-Flight handles the entrances and patented signal sensing follows the interior; Ariadne combines both centrally into one trajectory per visit, and the dwell time is the span of that visit. No camera is used, and the streams carry no MAC address, device ID, or biometric data. Two distinctions matter when you set this up:
- Dwell vs occupancy. Occupancy is how many people are inside right now; dwell is how long each stays. They move differently, and conflating them hides the leading-indicator signal.
- Placement and zoning. Centre-level dwell is the headline; zone-level dwell is where the action is. Instrument entrances plus key internal thresholds with a dwell-time instrumentation setup so you can localise a decline.
Centre-wide, this rolls up into a mall analytics platform view where dwell sits next to footfall and revenue per visit on one anonymous count.
Limitations of this read
Honesty about scope keeps the metric useful. This is a six-week window across a single region's centres, so it captures a season, not a year, and a geography, not the world. The headline number is a correlation, which signals a relationship but does not prove that longer dwell causes higher revenue per visit (a strong tenant mix could drive both). Treat the r-values as directional evidence for watching dwell, and validate the pattern against your own centres over a longer horizon before betting a leasing strategy on it.
FAQ
What is a good dwell time for a shopping centre?
There is no universal target. Dwell depends on format, tenant mix, and catchment, so the meaningful benchmark is your own centre's trend over time and comparisons between your own zones. A stable or rising dwell time is healthy; a multi-week decline is an early warning.
Why does dwell time predict conversion better than footfall?
Because longer visits mean more store entries, more considered purchases, and more exposure to food, beverage, and experiential tenants. In the six-week panel, dwell correlated with revenue per visit at r = 0.71 versus r = 0.43 for entry counts.
How far ahead does dwell time lead conversion?
Roughly four to six weeks: a sustained dwell decline tends to appear before the conversion drop reaches tenant sales reports, which is what makes it useful as an early-warning metric.
Do I need cameras to measure dwell time?
No. Ariadne counts with Hybrid Fusion: Time-of-Flight depth sensing plus patented phone signal sensing, never cameras. Time-of-Flight captures geometry rather than images, and signal sensing captures no MAC address by default, so the measurement involves no video, no faces, and no biometric data.
What is the difference between dwell time and occupancy?
Occupancy is how many people are inside at a moment; dwell time is how long each visitor stays. Both are useful, but only dwell behaves as a leading indicator of conversion.


