
A stadium knows, to the seat, how many people came in. The ticketing system scanned every one of them at the turnstile. What it does not know is what happens next: how the crowd spreads across the concourse at half-time, which food stands and toilets build the longest queues, and which gates and ramps choke when forty thousand people try to leave at once. Ticket scans are an ingress total. They are blind to the concourse, which is exactly where stadium operations succeed or fail in the two-minute windows when the entire crowd moves together.
Concourse counting measures that live flow by zone. It shows the half-time surge as it builds, the queues forming at concessions and toilets, and the egress pressure at each exit, so operations can open another till bank, redirect stewards, or stagger a gate before a crush forms. This guide covers the stadium-specific problem, the live uses during the surge, and how to count a vast public space without putting cameras on fans. Crowd safety is regulated, and counting is described here as an input to operations, never as a certified safety system or a guarantee against crushes.
Why count people on a stadium concourse?
Ticket scans tell a stadium who entered the building. They do not tell you how the crowd spreads across the concourse at half-time, where the queues build at food and toilets, or which gates and ramps bottleneck on egress. Concourse counting measures that live flow by zone, so operations can open another till bank, redirect stewards, or stagger an exit before a crush forms. The same data, reviewed after the event, shows which concession runs sold out because of throughput rather than demand.
The sections below take the surge, the queues, the egress, and the camera-free method that makes counting a vast public space workable.
The stadium pain point: the whole crowd moves in the same two-minute windows, and ticket scans cannot see the concourse
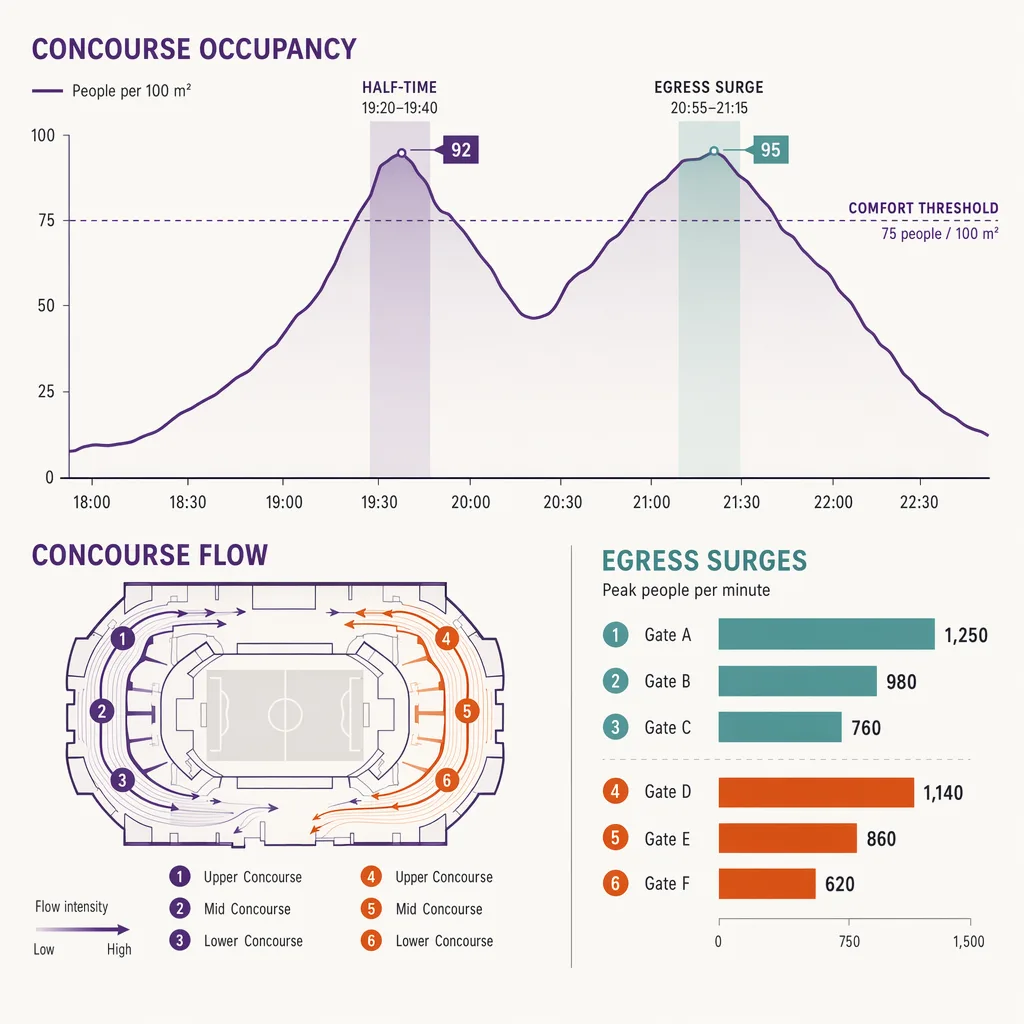
A stadium is not a steady-state building. For most of an event the concourse is calm and the crowd is seated. Then the half-time whistle blows and tens of thousands of people stand up and move toward the same concessions and toilets in the same ninety seconds. At full time they all leave through the same gates at once. The defining feature of the venue is that demand is not spread across hours, it is concentrated into a handful of violent peaks, and the operation either anticipates them or is overwhelmed by them.
Ticket scanning, the stadium's main source of crowd data, is no help here. It records entry at the turnstile and then goes silent. It cannot see that the west concourse is filling faster than the east at half-time, that the queue at one toilet block is twice the length of another, or that one egress gate is moving people while the next is jammed. The concourse is a blind spot at the exact moment it carries the most risk and the most revenue, and closing that blind spot needs live counting by zone, the kind set out in event crowd management data, not a turnstile total read after kickoff.
Live zone counts during the half-time and full-time surge
The highest-value use of concourse counting is live, during the surge itself. A control room watching zone counts update in real time sees the half-time wave build and spread unevenly across the concourse, and can act while it is still building rather than after it has jammed. Open a second till bank on the side that is filling, push stewards toward the heavier flow, hold or release a stand to balance the load. These are decisions measured in seconds, and they depend on a real-time count that updates fast enough to act on, not a figure reconciled the next morning.
The value is in seeing the asymmetry. Crowds never surge evenly; one side always fills first, one route always carries more. A live zone map shows which, so the response goes to the right place instead of being spread thin everywhere. Without it, operations are reacting to what stewards can see from where they happen to be standing, which in a concourse packed shoulder to shoulder is very little.
The half-time window has its own internal shape that a live count reveals. The surge does not arrive all at once; it builds over the first thirty to sixty seconds after the whistle as people leave their seats and reach the concourse, peaks hard, then drains back toward the seats before the second half. A control room watching that shape live knows the difference between a wave that is still building, where deploying stewards toward the heavier side is the right call, and one that has peaked and is about to clear on its own, where holding position avoids chasing a crowd that is already dispersing. The same is true at full time in reverse: the build is slower but does not drain, and the response is about steady throughput at the exits rather than balancing internal flow. Reading those two patterns correctly is the difference between staying ahead of the crowd and reacting after it has already jammed.
Queue build-up at concessions and toilets
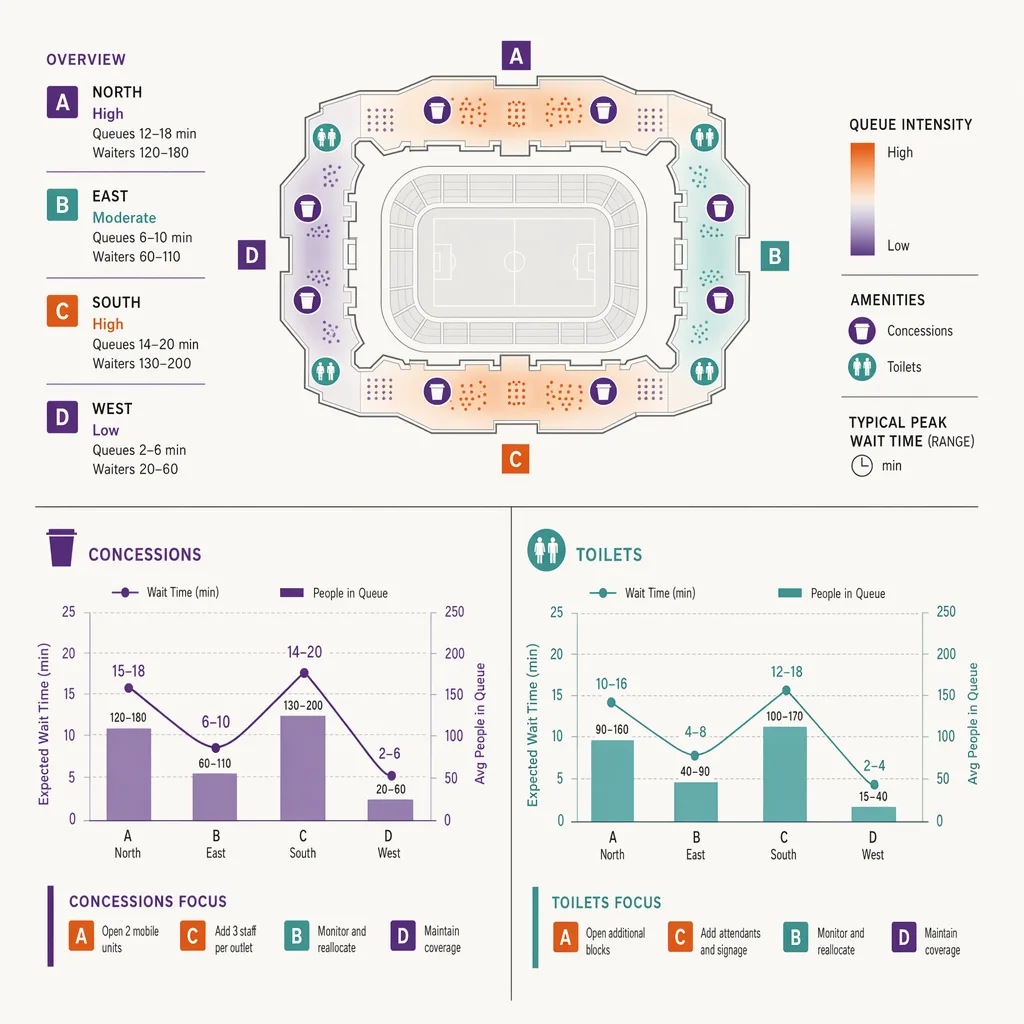
Two specific zones decide how the half-time experience feels and how much the concourse earns: the concession stands and the toilets. Both are throughput-limited, and both build queues fast when forty thousand people arrive in two minutes.
Counting the build at each makes the difference between a queue that is managed and one that simply forms and loses sales. If concession queues are measured live, staff and tills can be pushed to the busiest stands, and a stand that consistently sells out can be flagged, after the event, as throughput-limited rather than demand-limited, which is a different and more fixable problem. A concession that runs out is not always under-stocked; sometimes it simply could not serve people fast enough, and only the queue data tells you which. Toilet queues are a comfort and safety matter as much as an operational one, and knowing which blocks back up most lets a venue plan cleaning, staffing, and any temporary capacity around the real pattern.
The post-event review is where the concession data pays for itself across a season. A venue that runs the same fixtures repeatedly can build a picture of which stands serve the catchment around them well and which are chronically overwhelmed, which informs where to add tills, where to place a mobile unit, and where the bottleneck is the menu rather than the staffing (a stand serving slow-to-pour drinks will queue regardless of how many people are behind it). Read the concession traffic against takings and the venue can separate three different stories that look identical on a sales report: the stand that sold out of stock, the stand that could not serve fast enough, and the stand that simply sits in a low-traffic corner of the concourse. Each has a different fix, and only the traffic-against-sales comparison tells you which one you have.
Egress flow and crowd safety at gates and ramps
The end of an event is the highest-pressure moment in the building, when the entire crowd moves toward a limited set of gates and ramps at once. Concourse and exit counting gives operations a live view of how that egress is flowing: which gates are moving people steadily and which are backing up, where pressure is building on a ramp or stairwell, and whether a staggered release is balancing the load.
It has to be said plainly: counting is an input to a crowd-safety operation, not a safety guarantee and not a certified safety system. Crowd safety at scale is a regulated discipline run by qualified safety officers under formal plans, and the count is one data feed into that work, alongside trained stewards, CCTV operated under its own regime, and the venue's safety certificate. What counting adds is an objective, live measure of flow by zone that helps the safety team see pressure building and act on it earlier, in the spirit of acting on live flow. It does not replace the people or the plans that keep a crowd safe.
Within that boundary, the operational value is concrete. A staggered release, holding one stand or tier while another clears, is a standard egress tactic, and its effect is far easier to judge against a live flow figure than against a steward's eyeball estimate from one vantage point. A ramp or stairwell that is approaching the rate the safety plan treats as its working limit is exactly the kind of pressure a live zone reading surfaces before it is visible as a dangerous density, giving the safety team minutes rather than seconds to redirect or hold. After the event, the same per-zone flow record feeds the debrief that every regulated venue runs: which exits cleared at what rate, where the slow points were, and whether the egress plan held against the night's actual crowd. That after-action record is a genuine planning input for the next fixture, and it is the kind of objective measure a safety review benefits from having alongside the stewards' accounts.
Counting a vast public space without cameras on fans
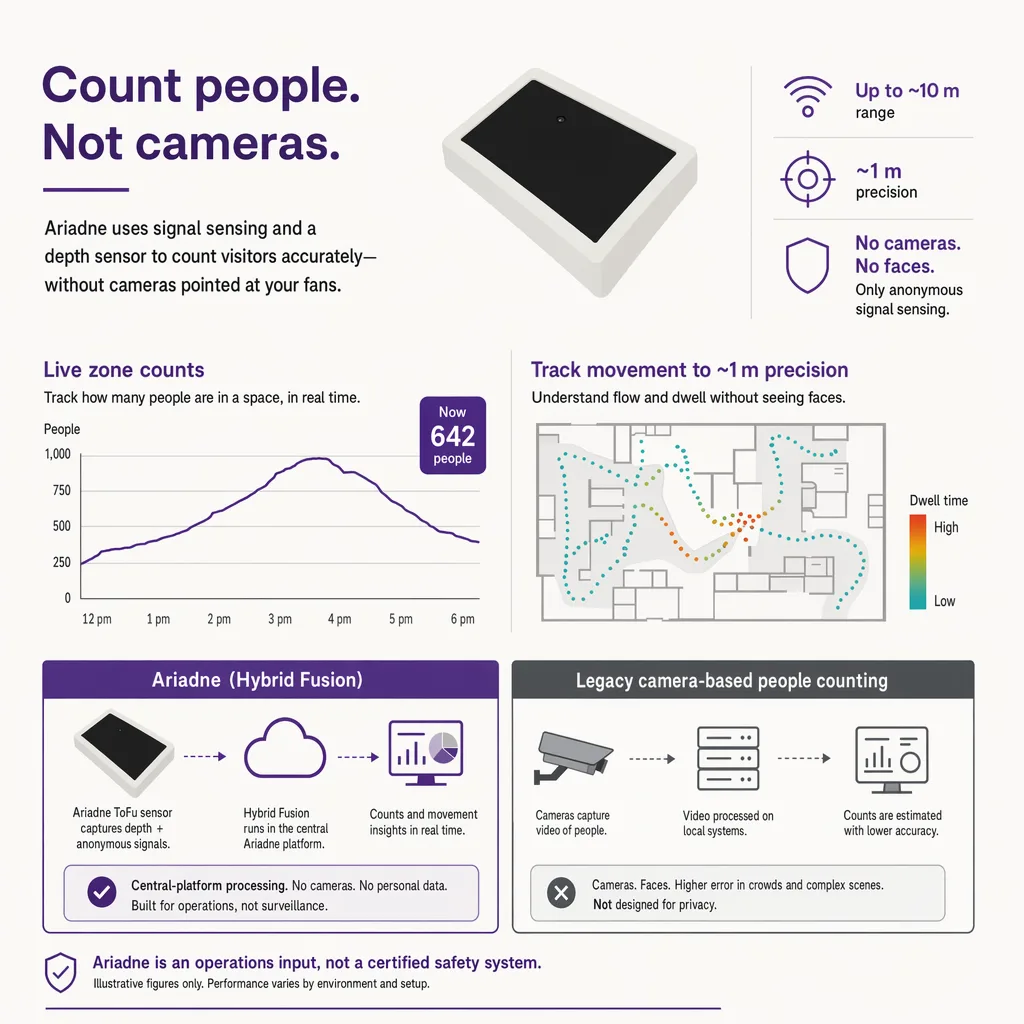
A stadium concourse is a huge public space full of tens of thousands of people, and the appetite for pointing more cameras at fans is, rightly, limited. Stadiums already operate CCTV under a regulated regime for security; an operations analytics layer should not add another bank of cameras recording the crowd. The counting needs to measure flow and density by zone without capturing the fans themselves, which is the argument for camera-free counting in a venue of this scale.
Ariadne measures this with Hybrid Fusion, its patented camera-free method. Time-of-Flight depth sensing counts every visitor at the entrances, capturing geometry rather than images, while patented phone signal sensing follows movement through the interior, detecting the signals a phone emits even in airplane mode, and tracks that movement to about one-metre precision. The sensor streams both feeds to Ariadne, where Hybrid Fusion combines them into one trajectory per visit and computes counts, dwell, and paths. The streams carry no identifier: no MAC address, no device ID, no biometric data, and no camera is involved. Identifiers are stored only when a visitor explicitly opts in, which keeps the method GDPR-friendly and outside biometric territory.
Because the method records geometry and signal rather than images, it gives the control room a live density and flow map without a single frame of a fan and without any record of who was there. It is an operations feed, not a surveillance one, and it stays out of the identity and recording territory that the venue's regulated CCTV occupies under its own controls. The zone view it produces can be read alongside zone heatmaps of the concourse to plan layout and stewarding for future events.
This separation also matters for the fan relationship a modern venue is trying to build. Clubs and venues increasingly market the matchday experience, the concourse, the food, the atmosphere, as part of what a ticket buys, and a wall of cameras pointed at the crowd to count it cuts against that promise. A counting layer that measures flow without recording faces lets a venue improve the experience, shorter queues, better-placed concessions, smoother egress, without asking fans to accept more surveillance in exchange. The operational gain and the fan-facing privacy stance point the same direction here, which is unusual and worth being explicit about: the camera-free method is not a compromise the venue tolerates for compliance, it is the option that serves both the operation and the crowd.
FAQ
What does concourse counting see that ticket scans do not?
Ticket scans record entry at the turnstile and then go silent. Concourse counting measures live flow by zone afterward: how the crowd spreads at half-time, which concessions and toilets queue, and how egress flows at each gate. It turns a single ingress total into a live map of where the crowd actually is.
Is concourse counting a crowd-safety system?
No. It is an operations input that helps a qualified safety team see pressure building earlier. Crowd safety at scale is a regulated discipline run under formal plans by safety officers, and counting is one data feed into that work. It is not a certified safety system and not a guarantee against crushes.
How does counting work without cameras on fans?
Depth sensing at concourse entry points measures the shapes of people passing, and phone-signal sensing follows anonymous movement across the concourse, fused centrally. No image of any fan is captured, so the system is an operations feed rather than another surveillance camera, separate from the venue's regulated CCTV.
Can it help with concession sales?
Yes. Measuring queue build at each stand lets operations push staff and tills to the busiest concessions live, and afterward distinguishes a stand that sold out from genuine demand versus one that simply could not serve people fast enough. That is a different and more fixable problem than under-stocking.
Does the system record which fans are present?
No. It counts how many people are in each zone and how they move, not who they are. No face and no device identifier is captured, and no personal data is collected at the sensor in the first place.
How does the data help between fixtures, not just during one?
The per-zone flow record feeds the post-event debrief that regulated venues run: which exits cleared at what rate, where the slow points were, and whether the egress plan held against the real crowd. Across a season of repeated fixtures, that builds an objective picture of which concessions and toilet blocks chronically overload and which exits bottleneck, which informs stewarding plans, till placement, and layout for future events alongside the stewards' own accounts.
Can it tell why a concession sold out?
Read against the takings, yes. The traffic at each stand separates three stories that look the same on a sales report: a stand that ran out of stock, a stand that could not serve fast enough, and a stand sitting in a low-traffic corner. Each has a different fix, from stocking to extra tills to relocation, and only the traffic-against-sales comparison tells you which one you are looking at.