
The mission-driven journey
Grocery is the anti-fashion: the shopper arrives with a mission, follows a practiced route, and treats time in store as a cost. The journey is short, habitual, and repeated weekly, which changes everything about how to read it. You are not trying to extend a grocery journey; you are trying to make the productive parts of it unavoidable and the unproductive parts painless.
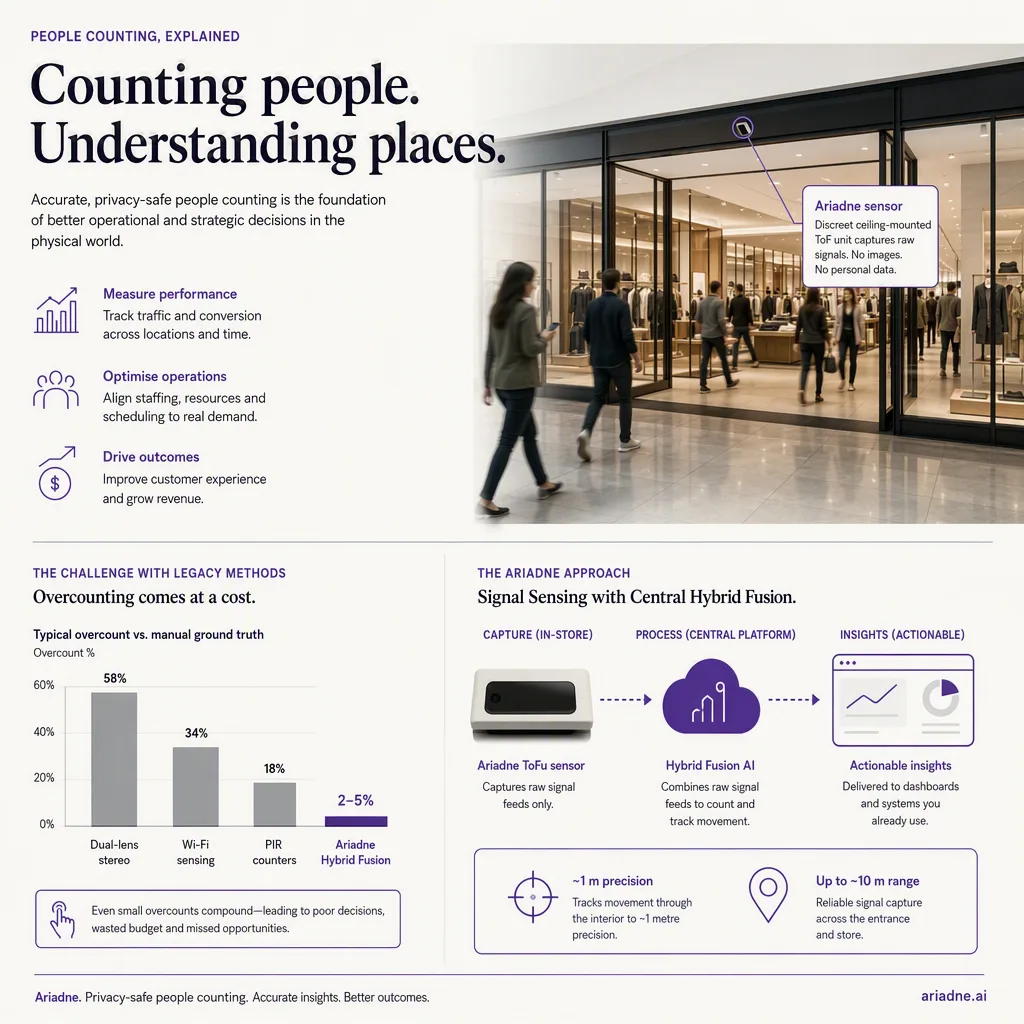
What does a typical grocery customer journey look like?
A loop with islands. Most grocery journeys enter, run the perimeter (produce, dairy, meat, bread anchor the outer ring in most layouts), dip into center aisles only for listed items, pause at a small number of dwell islands (deli counter, promotion bays, shelf-comparison moments), and end in the queue. The pattern repeats visit after visit, which makes deviations measurable: a new dwell island, a skipped aisle, a rerouted loop after a layout change.
Route habit is the asset
Because grocery journeys repeat, the store's flow pattern is stable enough to plan against. The perimeter loop determines which center-aisle entrances get passed and which never do; endcap value is a direct function of loop position. Measured zone-reach data shows which aisles a majority of journeys never enter, and those aisles are where listed-item categories belong, because a mission item pulls the shopper in where a promotion cannot. The store-wide reading technique is the same store heatmap interpretation used across retail.
Dwell islands: the only slow points worth engineering
Grocery dwell concentrates at a few points: service counters, comparison categories (wine, baby, health), and promotions. These islands are where impulse revenue and trade-marketing value live, and they are measurable as dwell per zone against the flow passing them. An island with heavy flow and no dwell is a placement problem; dwell with no flow is a location problem. The general distinction is covered in dwell time vs footfall.
The ending: queues tax the whole journey
Grocery journeys end at the till, and the queue is the last memory. Queue length at peak is a staffing decision fed by traffic curves; the demand side of that equation is covered in demand-based scheduling and the forecasting side in the 4-hour traffic forecast. A journey that went perfectly for eighteen minutes and badly for the last six did not go perfectly.
Measuring it, and what changes
Because the journey is habitual, small measured changes compound: a rerouted loop, a relocated island, a queue policy tied to the real arrival curve. Ariadne measures grocery journeys camera-free, as anonymous paths with per-zone dwell, visit after visit, which is what makes before/after comparison honest. Repeat behavior, grocery's defining trait, gets its own treatment in visit frequency analysis, and the mapping method lives in the pillar, customer journey mapping.
---


