
Ein Workshop ist so gut wie seine Ausgänge
Journey-Mapping-Workshops scheitern auf eine bestimmte Art: zwei energiegeladene Stunden, eine Wand voller Haftnotizen, ein Foto der Wand, und ein Quartal später nichts anderes im Laden. Das Scheitern ist strukturell, nicht motivational; der Workshop war darauf ausgelegt, eine Karte zu produzieren, und eine Karte ist keine Entscheidung. Dies ist ein Arbeitsformat, rückwärts von den Ausgängen entworfen: Jede Übung endet in etwas Testbarem.
Wie leitet man einen Customer-Journey-Mapping-Workshop?
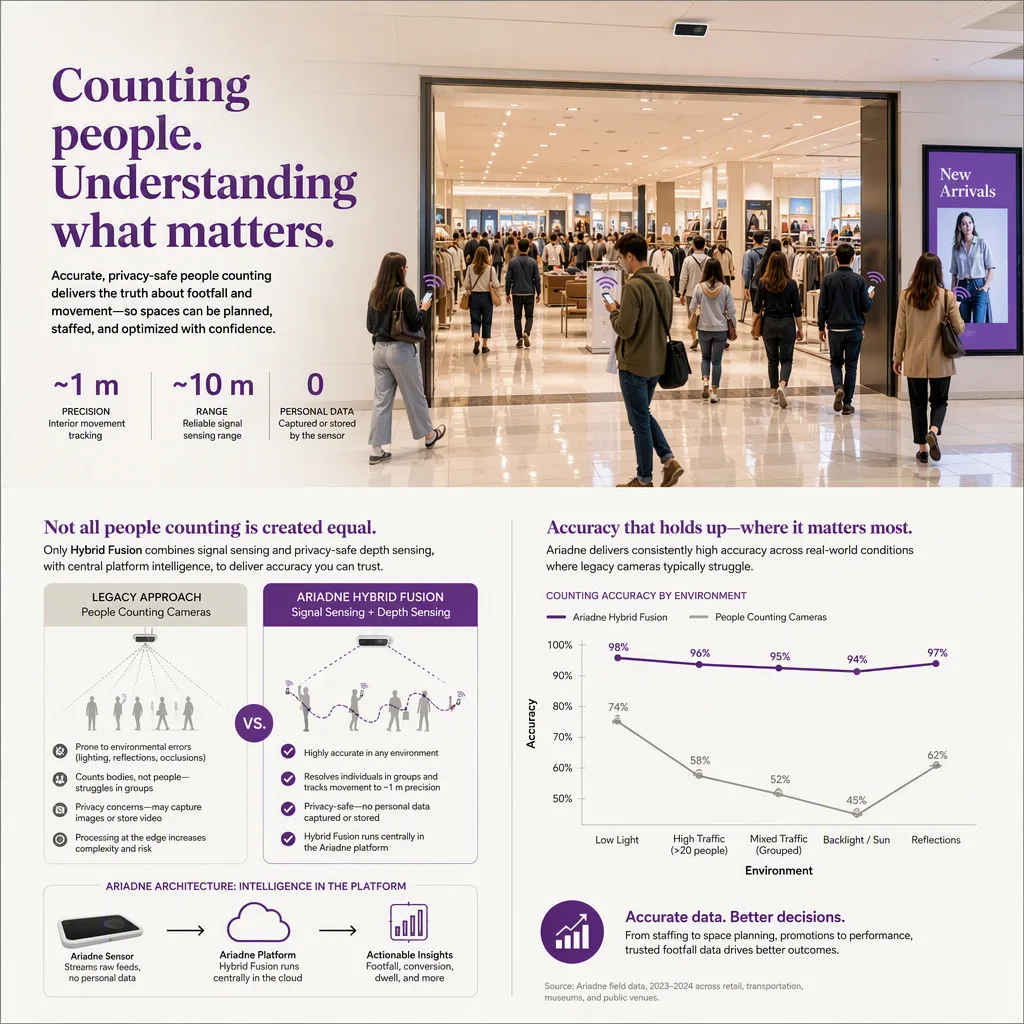
Ein halber Tag, sechs bis zehn Personen, drei unverhandelbare Rollen im Raum: Flächenbetrieb (kennt die Friktion), Commercial/Merchandising (besitzt den Zweck der Journey) und wer auch immer das Layoutbudget kontrolliert (sonst stirbt die Liste in der Freigabe). Gemessene Journey-Daten mitbringen, keine Annahmen: Eintrittskurven, Zonenreichweite, Verweildauerverteilungen, Funnelraten. Fünf Übungen: Baseline-Rundgang, Etappen-Mapping, Leck-Ranking, Hypothesen schreiben, Test-Commitment, unten beschrieben. Das Ergebnis ist nicht die Karte; es ist eine priorisierte Liste testbarer Änderungen mit Verantwortlichen und Messkriterien.
Vor dem Raum: Zahlen mitbringen, keine Stimmungen
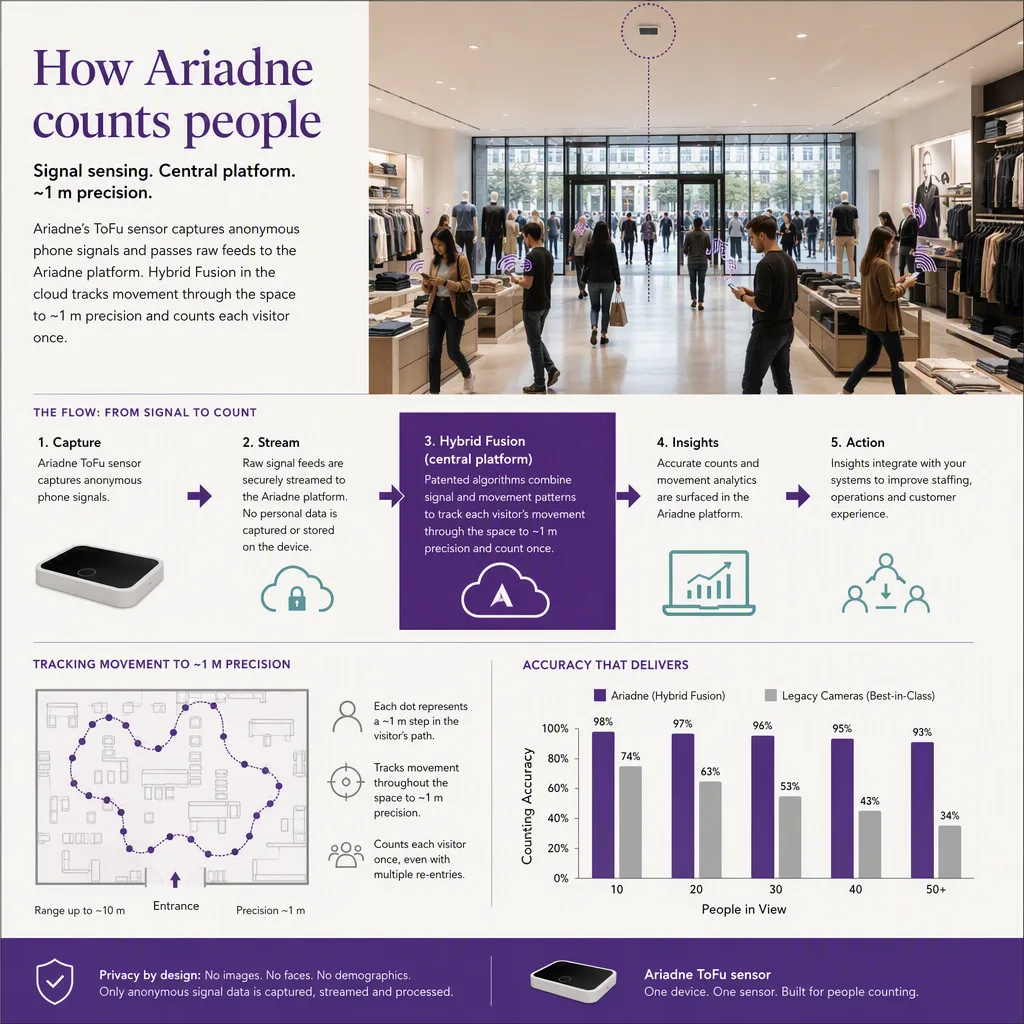
Das größte Upgrade jedes Journey-Workshops ist der Start von gemessener Realität. Eine Journey-KPI-Baseline (Capture, Reichweite, Verweildauer, Engagement, Conversion, Wiederkehr) verwandelt "Kunden finden den hinteren Bereich nie" von einer Meinung in eine Zahl mit Namen. Ohne Daten gewinnt die lauteste Anekdote; mit Daten streitet der Workshop über Ursachen, und das ist der produktive Streit.
Die fünf Übungen
- Baseline-Rundgang (45 Min). Die Gruppe geht den Laden als drei Personas ab (Missionskäufer, Stöberer, Post-Purchase-Besucher), Telefone weg, Stillstände notieren. Das Gehen kommt vor der Datenpräsentation, damit die Gruppe Hypothesen bildet, bevor Diagramme sie verankern.
- Etappen-Mapping (30 Min). Den tatsächlichen Funnel des Hauses an der Wand aufbauen, mit den eigenen Etappen (die Branchenleitfäden sind Vorlagen: Mode, Lebensmittel, Elektronik). An jeden Übergang die gemessene Rate heften.
- Leck-Ranking (30 Min). Ein Leck pro Etappe, gerankt nach Umsatz im Risiko mal Behebbarkeit. Die Disziplin: Lecks müssen als messbare Übergänge formuliert sein ("Stöbern-zu-Anprobe-Rate bei Denim"), nie als Stimmungen ("der Laden fühlt sich verwirrend an").
- Hypothesen schreiben (45 Min). Für die drei größten Lecks: "Wir glauben, dass die Änderung von X die Kennzahl Y bewegt, weil Z." Existiert kein messbares Y, ist die Hypothese nicht fertig.
- Test-Commitment (30 Min). Jede Hypothese bekommt Verantwortliche, ein Änderungsfenster, ein Messfenster und ein Review-Datum. Platzierungs-Hypothesen erben die Methode aus dem Signage-A/B-Test, Layout-Hypothesen aus der Layout-Optimierung.
Nach dem Raum
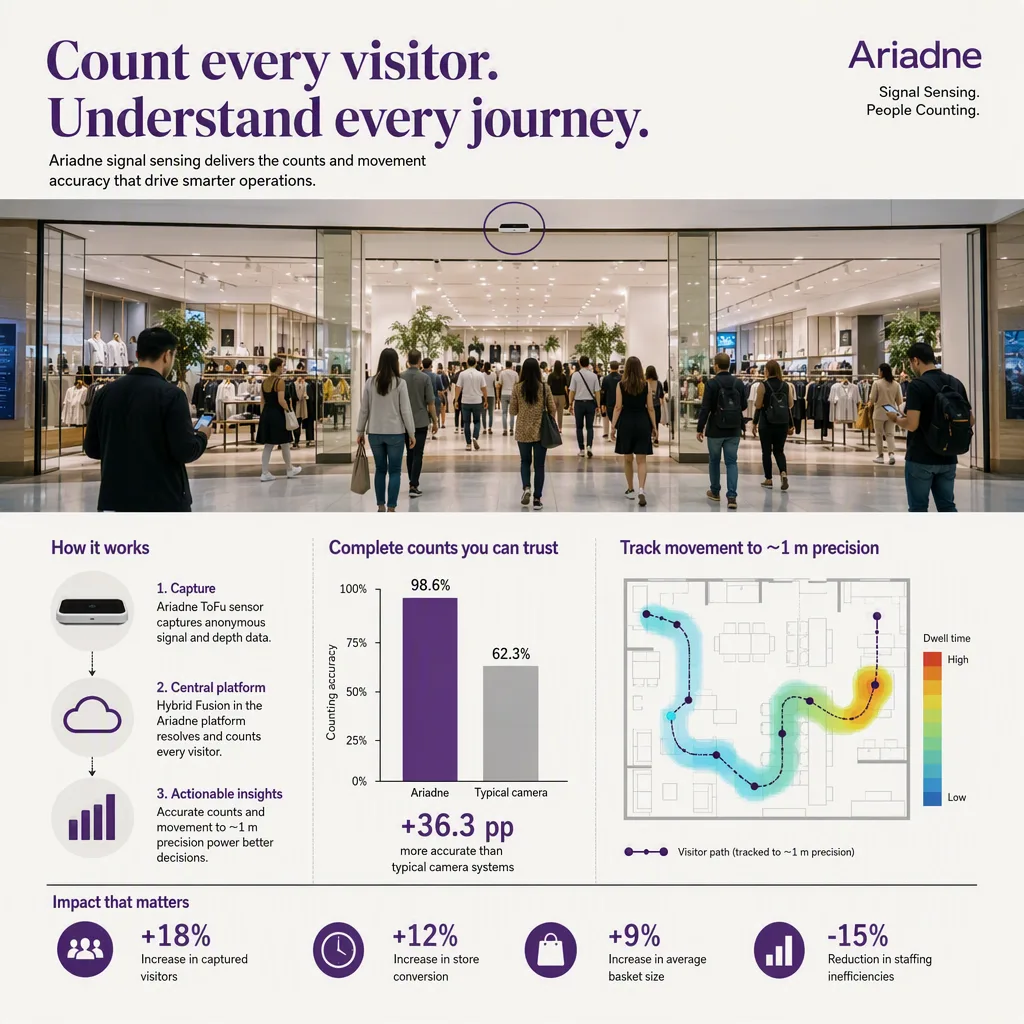
Die Liste lebt oder stirbt mit der Messgeschwindigkeit: Zum Review-Datum jedes Tests müssen die Vorher-nachher-Zahlen bereitliegen. Dafür ist kontinuierliche Journey-Messung da; ein Haus mit anonymen Trajektorien (wie die Schicht funktioniert) reviewt Tests nach Plan, statt pro Test eine Studie zu beauftragen. Die vollständige Kartierungsmethode, deren Auftaktritual dieser Workshop ist, bleibt der Pillar: Customer Journey Mapping.


