Ariadne Analytics


Ariadne Analytics
Echtzeitanalyse
Gesamt - Personenzählung
Etage 2 - Personenzählung
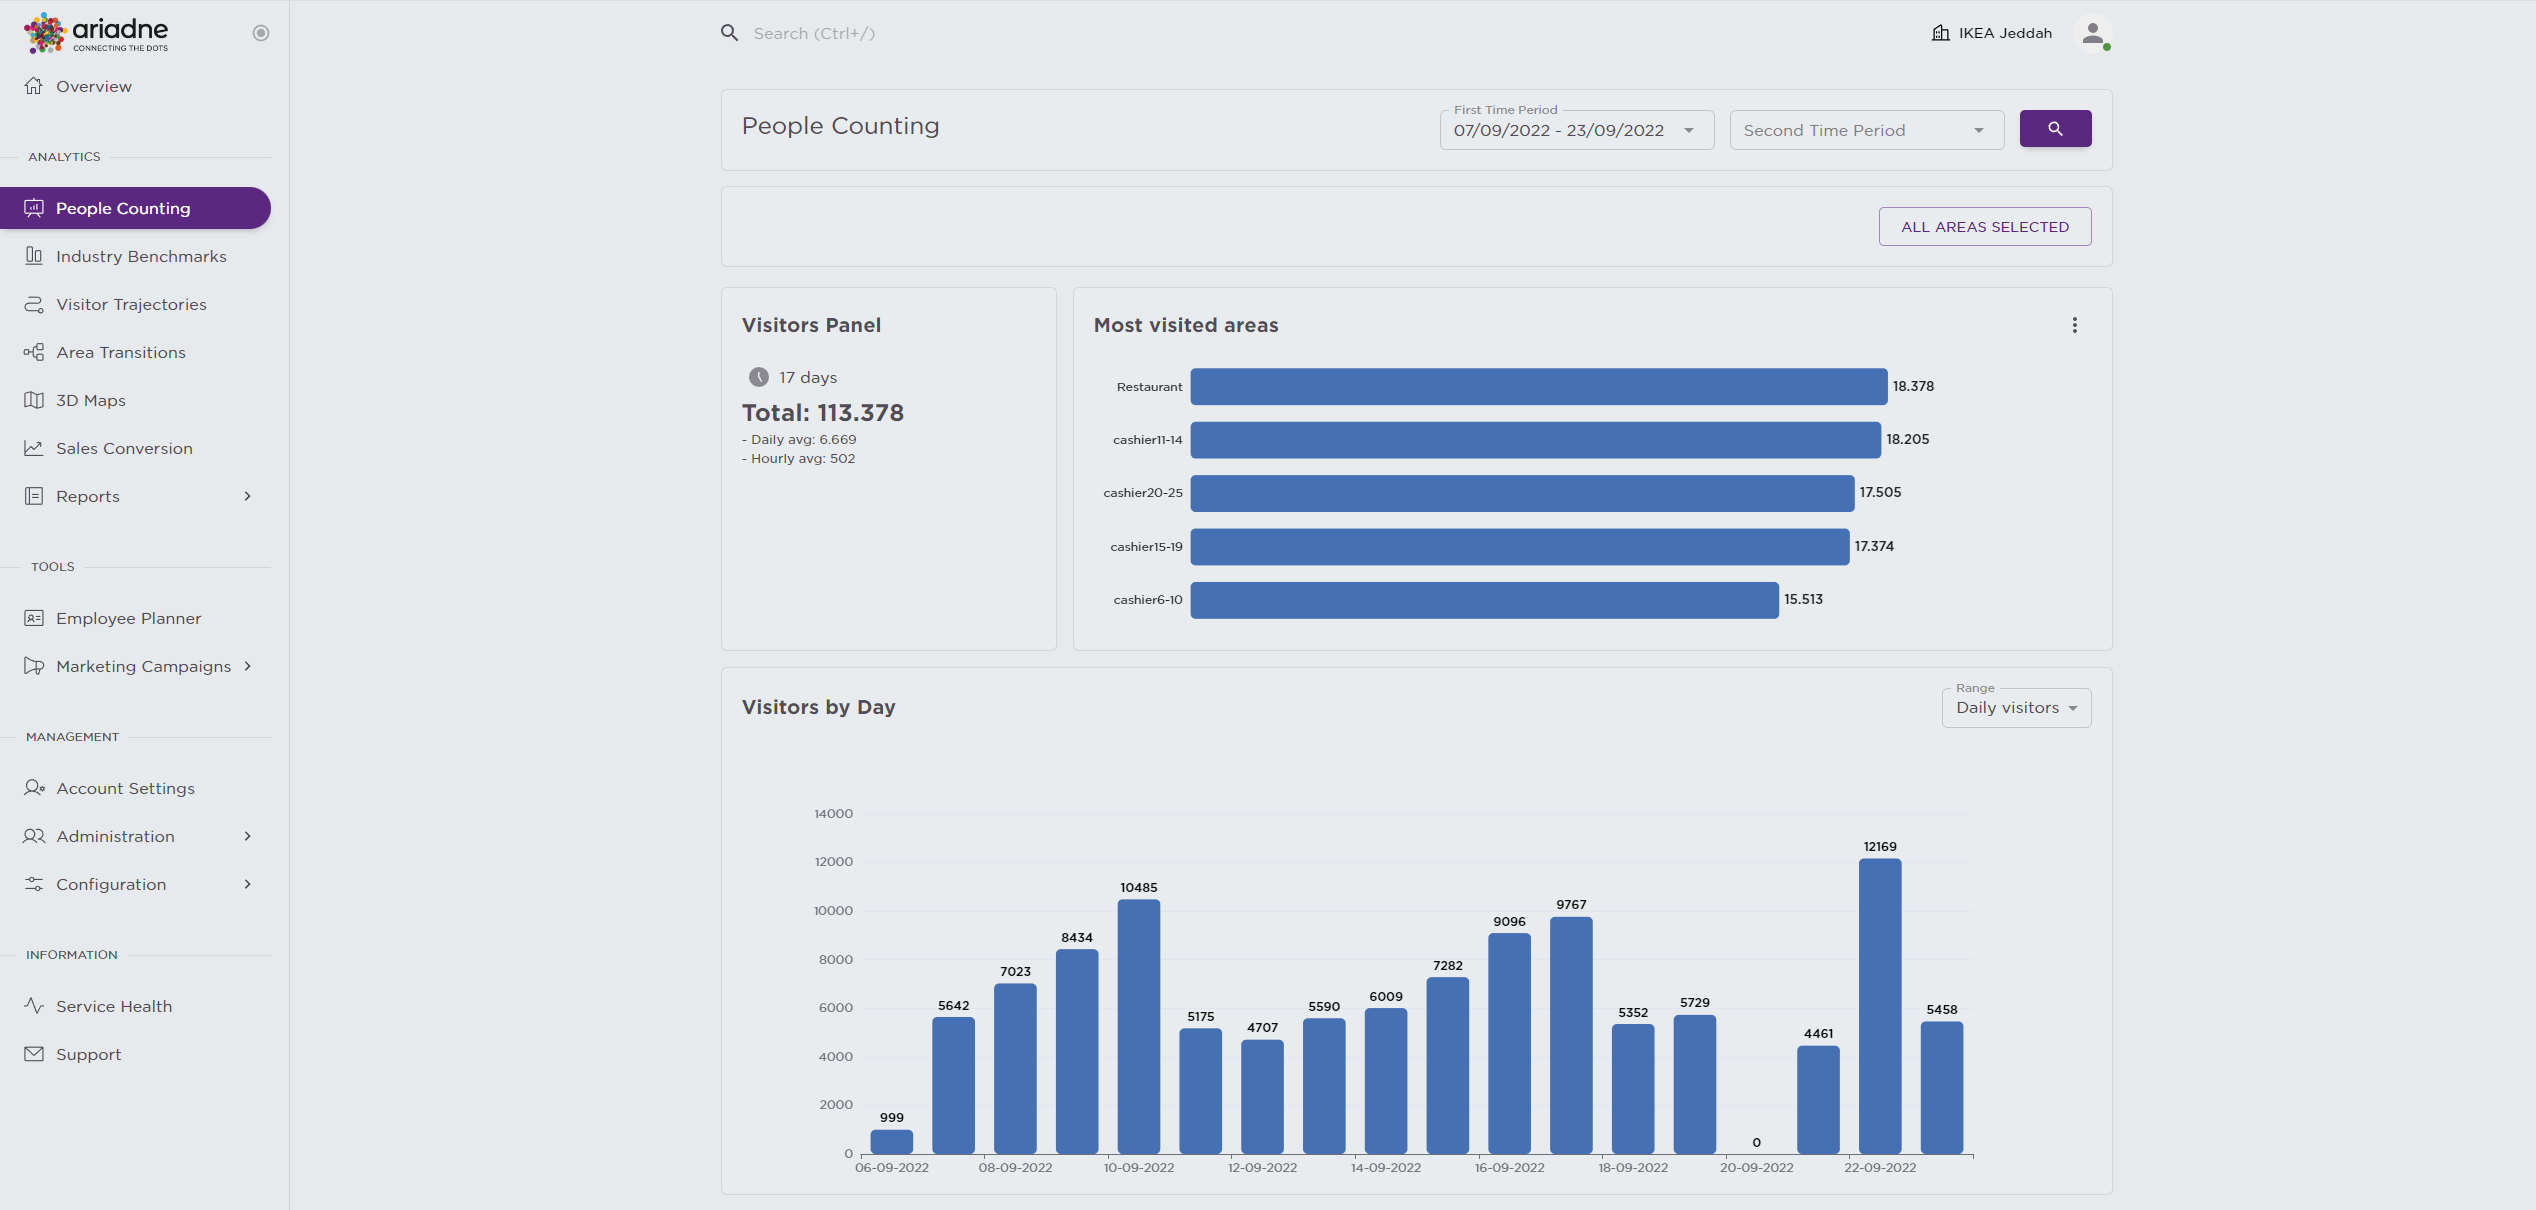
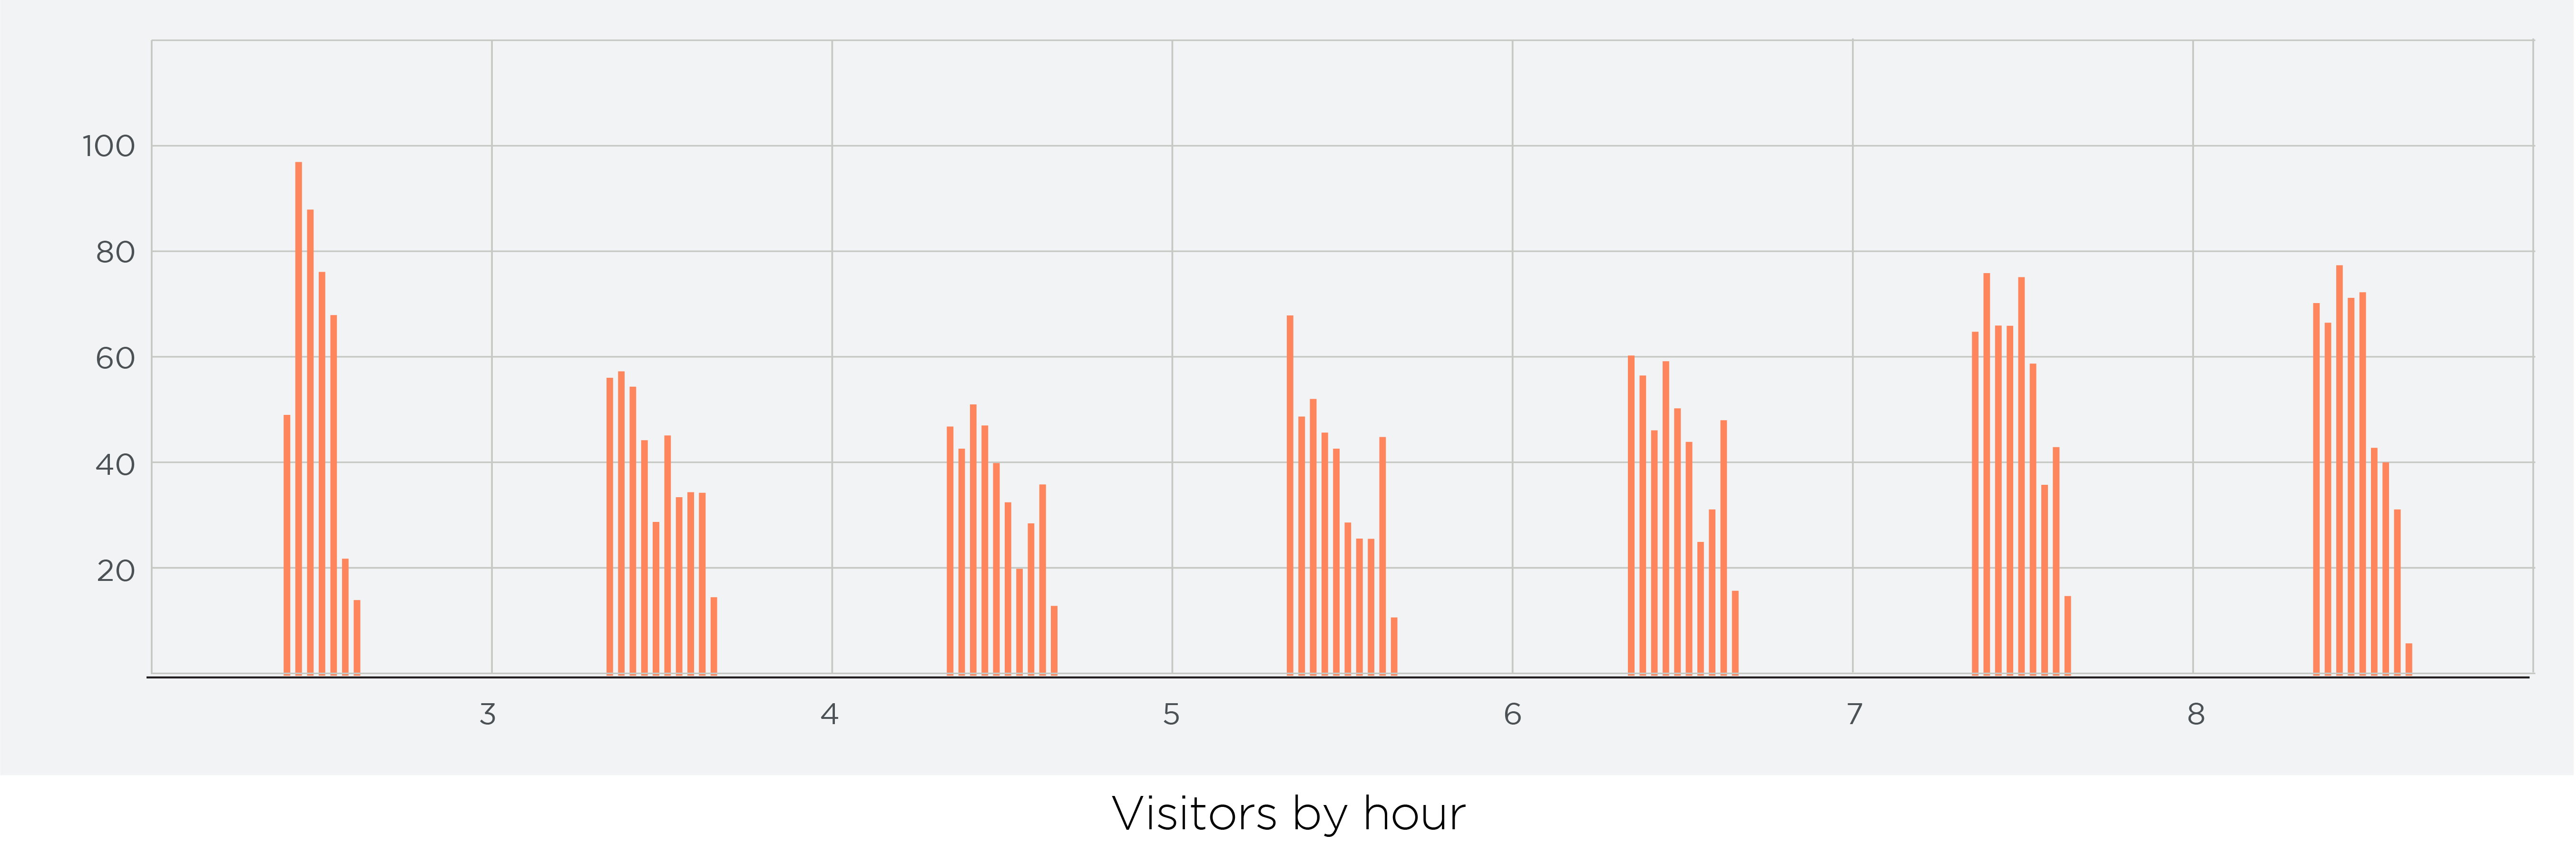
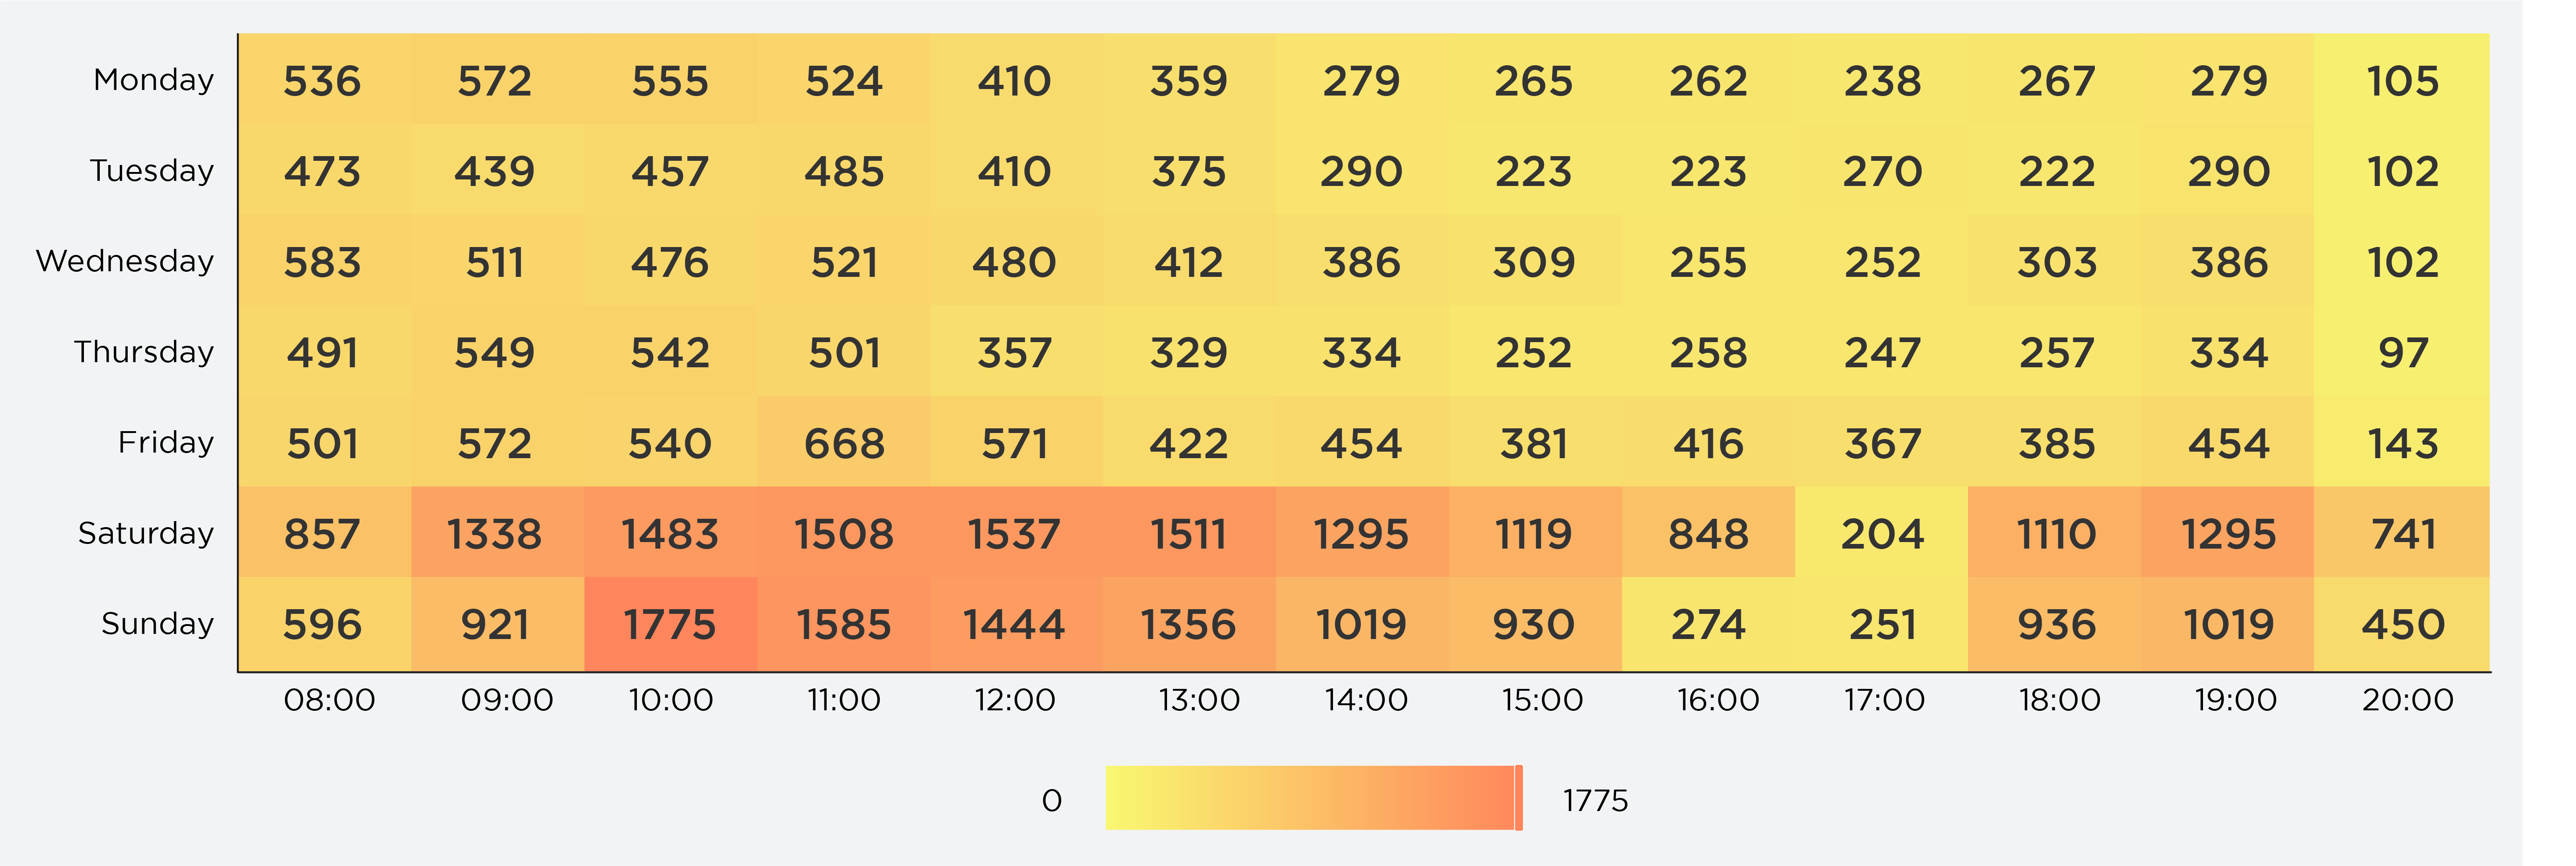
Anzahl Personen
Anzahl der Personen nach Gebiet
Grundlegende Analysen - Verweildauer
Verweilzeit nach Bereich
Durchschnittliche Dauer ab Ankunft
Anzahl der Personen nach aufgewendeter Zeit
Warnungen
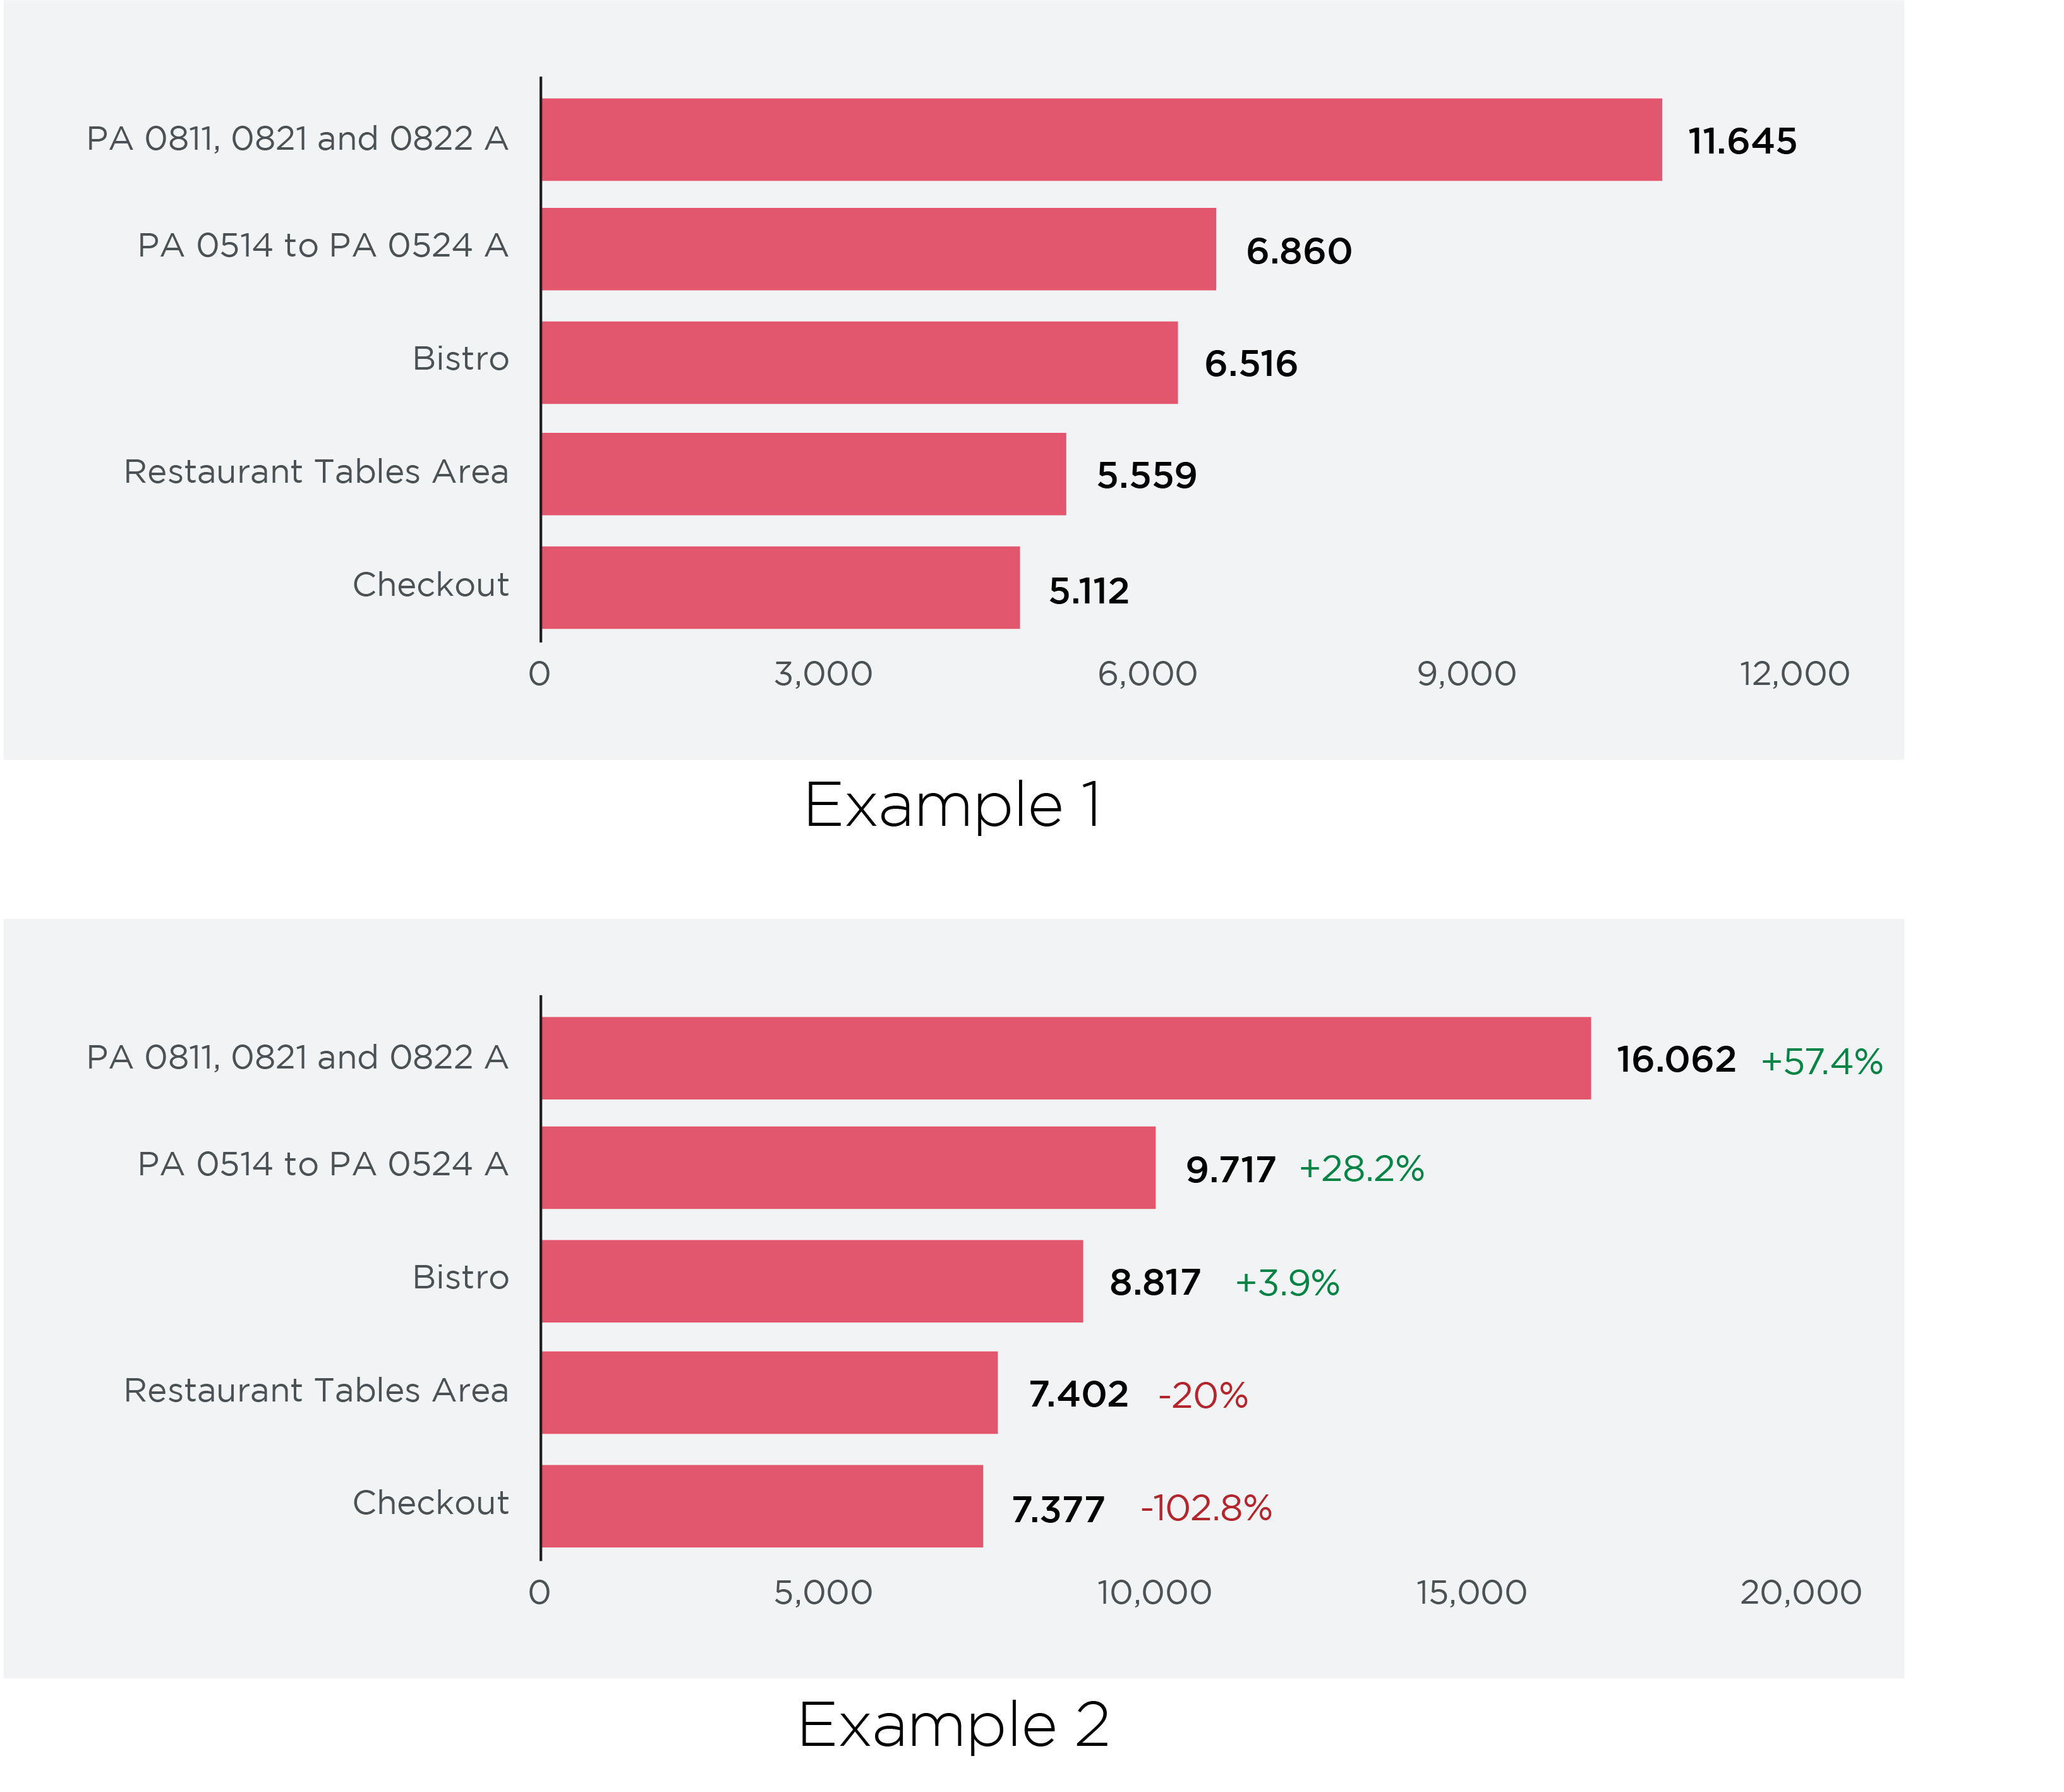
Anzahl der Personen nach besuchten Gebieten
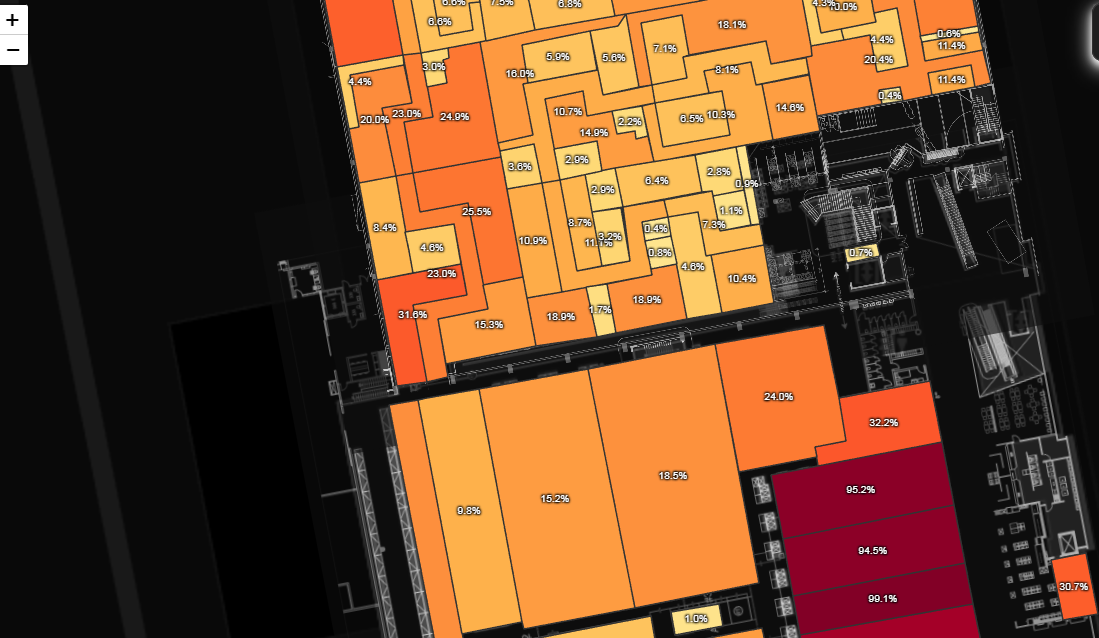
Erweiterte Analysen - Heatmap
Heatmap
Heatmap (3D)
Advanced Analytics - Produkterfolg
Kunden/Bereich nach Verweildauer
Kunden - Verweildauer - Fläche
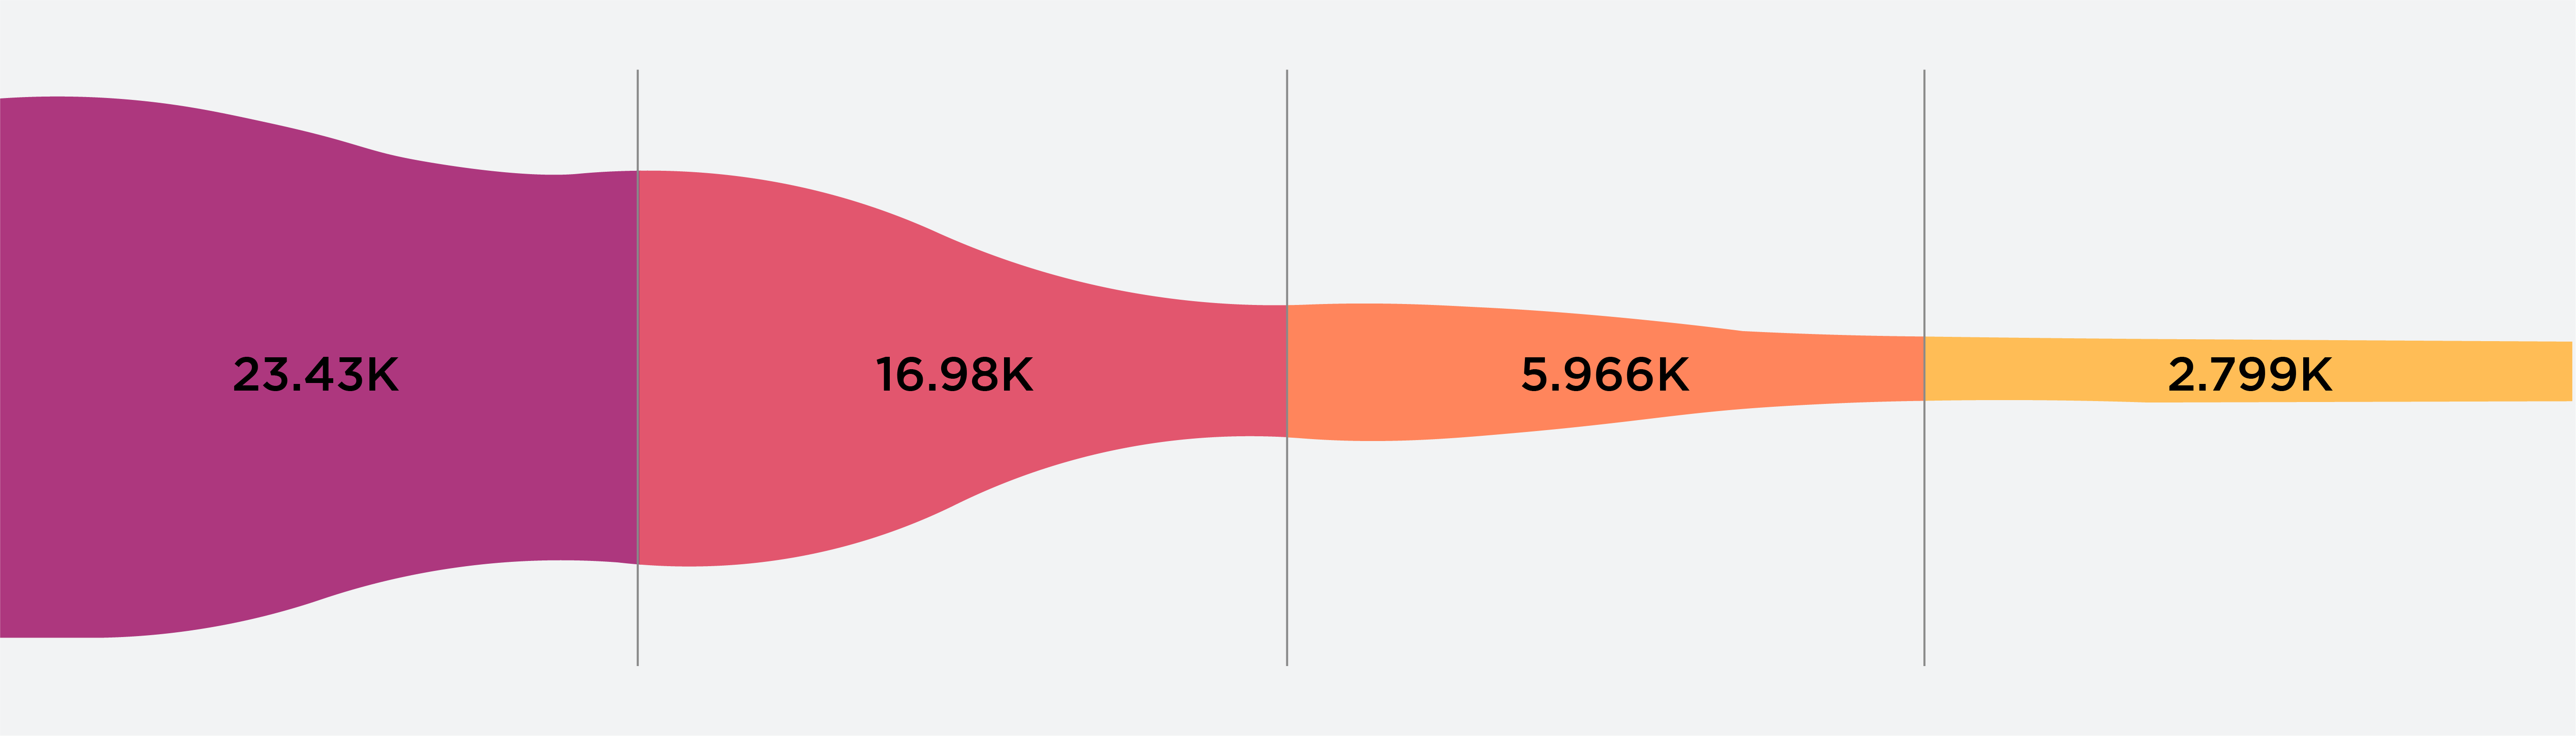
Erweiterte Analyse - Übergänge
Übersicht der Übergänge
Übergang der Personenzahl
And when it comes to visualizing the differences between areas, you have the freedom to choose the method that works best for you. The legend will guide you in interpreting the values on the map, giving you the knowledge you need to make informed decisions based on your data.
Visitor Trajectories
The visitor trajectories, also visualized in the following video, enables you to monitor the flow of visitors, or your visitor’s trajectories. This can provide several benefits, including:
Improving Customer Experience: By understanding how customers move through the store, you can optimize the layout and design to improve the customer experience. For example, if a certain area of the store is often congested, the layout can be adjusted to reduce traffic and improve the flow of customers.
Increasing sales: By analysing visitor trajectories, you can identify popular areas of the store and optimize product placement to increase sales. For example, if a certain product category is frequently visited but not frequently purchased, you can adjust product placement or pricing to encourage sales.
Reducing operational costs: By identifying areas of the store that are underutilized, you can adjust staffing levels and optimize operations to reduce costs.
Optimizing marketing and promotions: By analysing visitor behaviour, you can tailor marketing and promotional campaigns to specific areas of the store or specific customer segments, increasing the effectiveness of these efforts.